May 2024 Update Rentals.ca Rent Report
Author: Urbanation & Rentals.ca
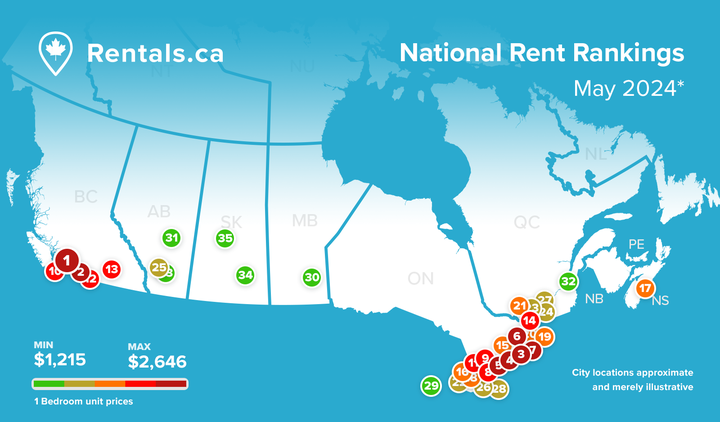
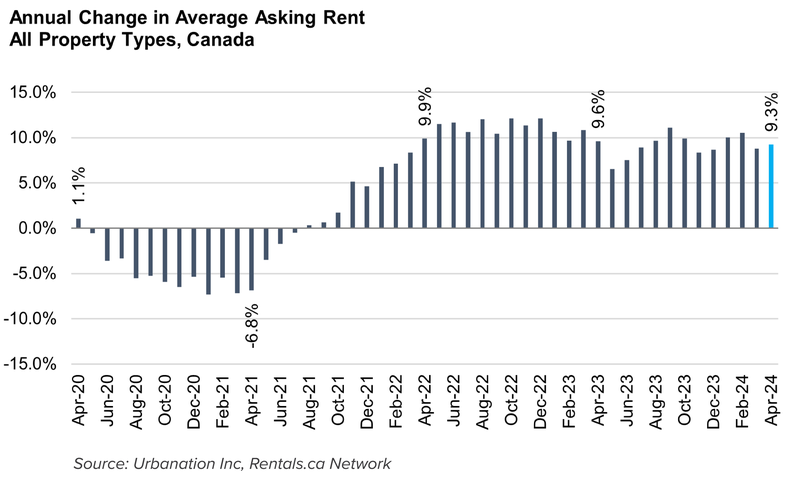
Asking rents for all residential property types in Canada remained near a record high in April, averaging $2,188 per month. Rents increased 9.3% annually in April, accelerating from an 8.8% annual growth rate in March.
| RANK** | CITY/AREA | 1 BED | M/M | Y/Y | 2 BED | M/M | Y/Y |
|
1
|
Vancouver, BC | $2,646 | 0.5% | -5.1% | $3,605 | -0.2% | -3.6% |
|
2
|
Burnaby, BC | $2,553 | 0.8% | 9.6% | $3,153 | 0.5% | -2.4% |
|
3
|
Toronto, ON | $2,459 | -0.5% | -2.7% | $3,224 | -0.7% | -2.0% |
|
4
|
Etobicoke, ON | $2,281 | 0.7% | 1.9% | $2,858 | 0.9% | -1.1% |
|
5
|
Mississauga, ON | $2,277 | -0.3% | 0.7% | $2,682 | -0.3% | -2.0% |
|
6
|
Kanata, ON | $2,235 | -1.1% | 0.2% | $2,798 | -2.3% | 15.4% |
|
7
|
Scarborough, ON | $2,173 | 0.8% | 5.1% | $2,620 | 2.6% | 4.6% |
|
8
|
Burlington, ON | $2,156 | 0.5% | -0.7% | $2,616 | 1.1% | 3.3% |
|
9
|
Brampton, ON | $2,137 | -1.3% | 3.0% | $2,379 | 0.1% | -2.6% |
|
10
|
Victoria, BC | $2,113 | 0.1% | 5.4% | $2,769 | 3.4% | 6.3% |
|
11
|
Guelph, ON | $2,112 | 1.4% | -9.2% | $2,488 | 0.8% | 3.1% |
|
12
|
Surrey, BC | $2,097 | -0.1% | 8.7% | $2,543 | 0.5% | 6.2% |
|
13
|
Kelowna, BC | $2,009 | 1.0% | 2.9% | $2,484 | 0.0% | -4.3% |
|
14
|
Ottawa, ON | $1,980 | -2.8% | 2.1% | $2,469 | -0.8% | 4.0% |
|
15
|
Barrie, ON | $1,935 | 2.4% | -4.9% | $2,213 | -1.2% | -10.4% |
|
16
|
Kitchener, ON | $1,932 | 0.4% | 1.0% | $2,321 | 0.1% | -2.7% |
|
17
|
Halifax, NS | $1,891 | -0.2% | 1.6% | $2,465 | -0.2% | 15.7% |
|
18
|
Hamilton, ON | $1,840 | -0.9% | -1.9% | $2,218 | 0.9% | -1.9% |
|
19
|
Oshawa, ON | $1,823 | 1.0% | 0.8% | $2,145 | -0.1% | 1.6% |
|
20
|
Brantford, ON | $1,791 | 0.1% | 2.2% | $1,990 | -0.7% | 0.5% |
|
21
|
Kingston, ON | $1,790 | -2.3% | 8.3% | $2,261 | -0.7% | 10.3% |
|
22
|
London, ON | $1,770 | -0.7% | 2.3% | $2,177 | 1.7% | 3.6% |
|
23
|
Gatineau, QC | $1,764 | 0.1% | 1.1% | $2,214 | -0.4% | 15.3% |
|
24
|
Montreal, QC | $1,751 | 0.3% | 5.8% | $2,337 | 0.4% | 7.7% |
|
25
|
Calgary, AB | $1,736 | 1.7% | 8.0% | $2,133 | 1.6% | 6.1% |
|
26
|
St. Catharines, ON | $1,663 | 0.5% | -0.5% | $1,936 | -0.8% | -1.7% |
|
27
|
Laval, QC | $1,601 | 0.3% | 2.0% | $2,043 | 1.0% | 0.0% |
|
28
|
Niagara Falls, ON | $1,554 | -3.8% | -14.4% | $1,960 | 0.6% | -1.6% |
|
29
|
Windsor, ON | $1,553 | 0.5% | -4.1% | $1,852 | -1.7% | -1.2% |
|
30
|
Winnipeg, MB | $1,380 | 1.1% | 6.7% | $1,766 | 1.5% | 9.2% |
|
31
|
Edmonton, AB | $1,353 | 1.1% | 16.4% | $1,665 | 0.7% | 11.8% |
|
32
|
Quebec City, QC | $1,294 | 0.5% | 5.8% | $1,679 | -4.1% | 10.0% |
|
33
|
Lethbridge, AB | $1,289 | 0.5% | 9.4% | $1,490 | 0.3% | 11.7% |
|
34
|
Regina, SK | $1,251 | -1.3% | 14.7% | $1,466 | -0.7% | 10.4% |
|
35
|
Saskatoon, SK | $1,215 | 1.6% | 8.4% | $1,417 | -0.8% | 14.8% |
| ALL CANADIAN CITIES *** | $1,944 | 0.4% | 11.8% | $2,338 | 0.4% | 11.6% | |
| Urbanation & Rentals.ca Network Research Data | |||||||
| N/D = insufficient data | |||||||
| *Figures represent previous month's data | |||||||
| **Rankings based on average rent price of vacant 1-bed units | |||||||
| ***Average values encompass entire rental database including all property types |
National Overview
| Average Rent in Canada, Broken down by Property Type and Unit Type | ||||||||||
| Average Rent | % Change Y/Y | |||||||||
| TYPE | TOTAL | 0B | 1B | 2B | 3B | TOTAL | 0B | 1B | 2B | 3B |
| Apartment | $2,124 | $1,575 | $1,932 | $2,337 | $2,641 | 13.1% | 17.2% | 13.6% | 13.2% | 12.6% |
| Condominium | $2,331 | $1,844 | $2,115 | $2,492 | $2,959 | 3.8% | -0.6% | 3.2% | 5.5% | 10.6% |
| House/Townhouse | $2,323 | ND | $1,545 | $2,015 | $2,507 | 4.7% | 0.0% | 12.2% | 11.0% | 7.1% |
| All | $2,188 | $1,586 | $1,915 | $2,295 | $2,550 | 9.3% | 14.9% | 11.8% | 11.6% | 9.9% |
| Source: Urbanation Inc., Rentals.ca Network data |
Asking Rents in Canada Rise 9% from Last Year
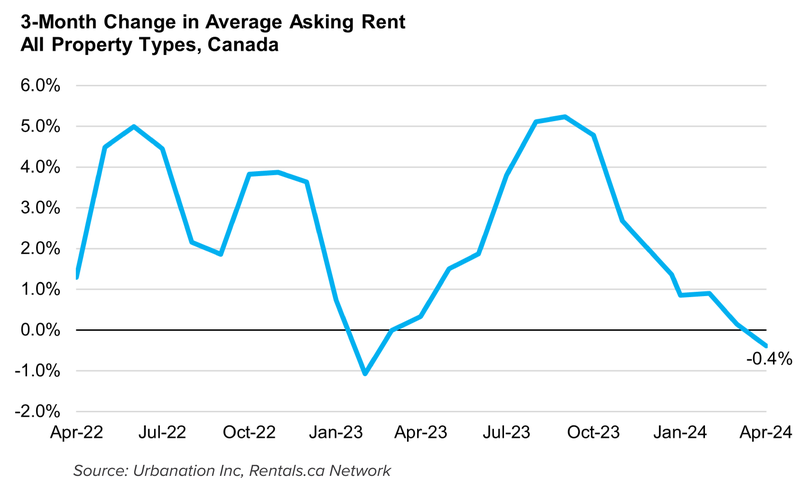
April marked the three-year anniversary since rents fell to their COVID-19 low of $1,662 in April 2021. Since that time, rents have increased by a total of 32% or an additional $526 per month.
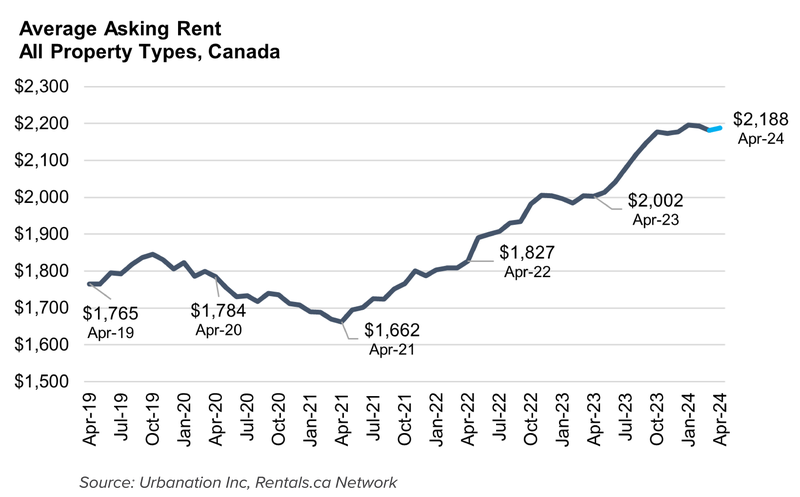
Average asking rents edged up 0.3% month-over-month in April, representing the first monthly increase in rents since January 2024. However, rents were down slightly by 0.4% over the past three months, illustrating an ongoing moderation in rent growth following the sharp acceleration that occurred during the spring and summer of 2023.
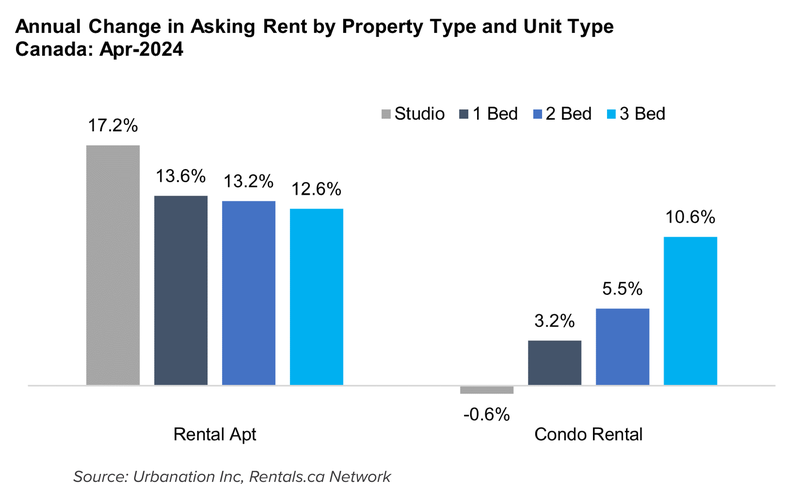
Studio Rents Up 17% for Purpose-built Rentals and Down 1% for Condo Rentals
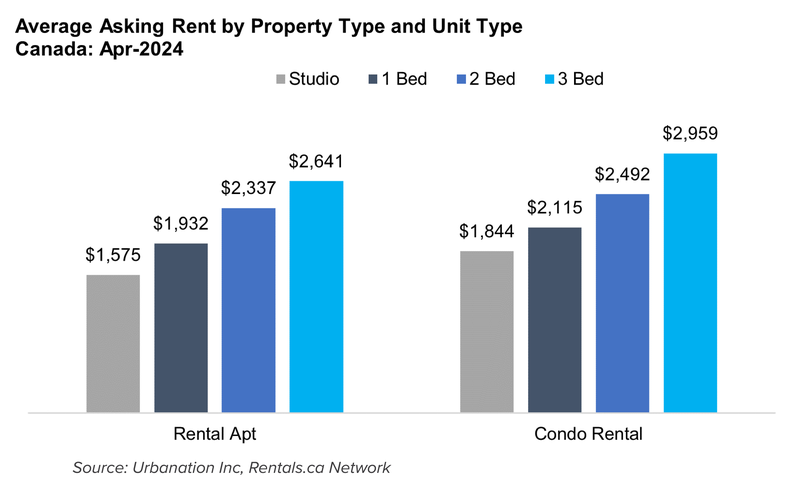
Asking rents for purpose-built and condominium rental apartments increased 9.3% year-over-year in April to reach an average of $2,188. However, there was a large difference in annual growth between purpose-built rentals, which increased 13.1% to an average of $2,124, and condo rentals, which increased 3.8% to an average of $2,331.
The least expensive units represented by purpose-built studios experienced the fastest growth in rents over the past year, increasing 17.2% to an average of $1,575. Conversely, condo studios recorded an annual decrease of 0.6% to an average of $1,844 as a large volume of units finished construction and became available to rent. Three-bedroom condo rentals, which are much lower in supply, saw rents rise 10.6% annually to an average of $2,959.
Provincial Overview
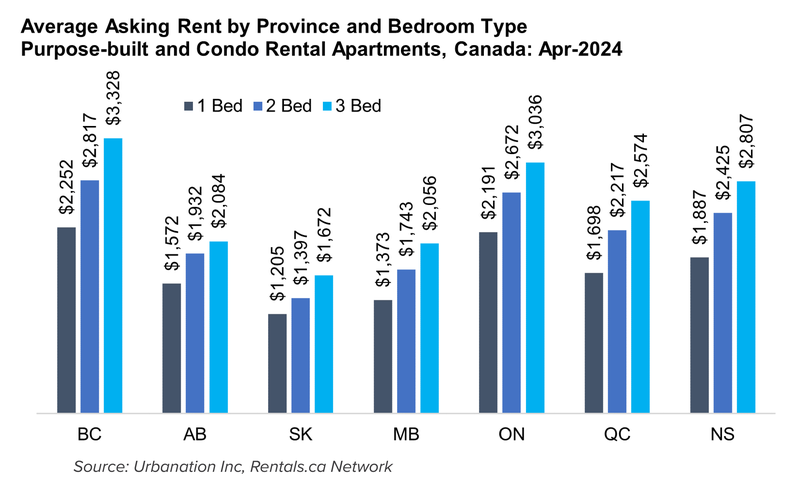
| Average Listed Rent by Province and Unit Type for Apt. and Condo Listings: May 2024 | ||||||||||
| Average Rent | % Change Y/Y | |||||||||
| PROV. | TOTAL | 0B | 1B | 2B | 3B | TOTAL | 0B | 1B | 2B | 3B |
| AB | $1,746 | $1,151 | $1,572 | $1,932 | $2,084 | 16% | 15% | 17% | 15% | 21% |
| Atl. Can | $2,003 | $1,448 | $1,787 | $2,243 | $2,443 | 12% | 15% | 5% | 19% | 14% |
| BC | $2,507 | $1,954 | $2,252 | $2,817 | $3,328 | 2% | 3% | 5% | 3% | 1% |
| MB | $1,609 | $1,080 | $1,373 | $1,743 | $2,056 | 10% | 5% | 7% | 10% | 5% |
| NT | $1,840 | $1,175 | $1,540 | $1,936 | $2,298 | 5% | -4% | 7% | 10% | 15% |
| ON | $2,404 | $1,801 | $2,191 | $2,672 | $3,036 | -1% | 0% | 0% | 0% | 4% |
| QC | $2,011 | $1,448 | $1,698 | $2,217 | $2,574 | 9% | 9% | 5% | 10% | 9% |
| CAN | $2,150 | $1,590 | $1,955 | $2,359 | $2,668 | 11% | 15% | 12% | 11% | 12% |
| Source: Urbanation Inc., Rentals.ca Network data |
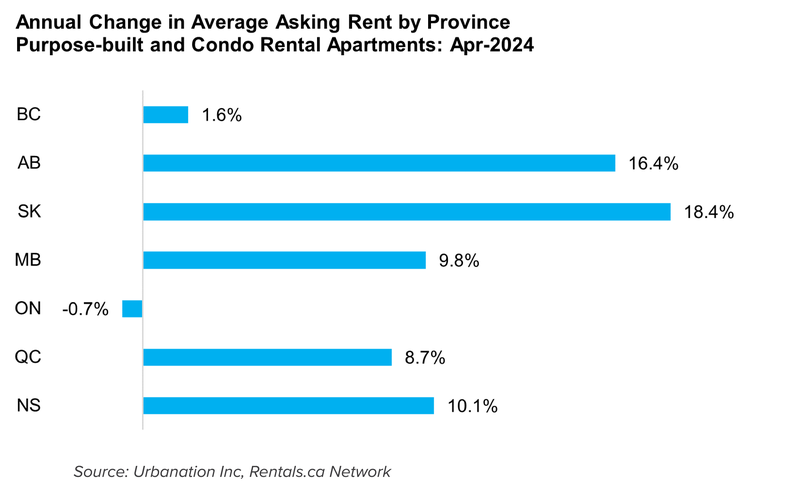
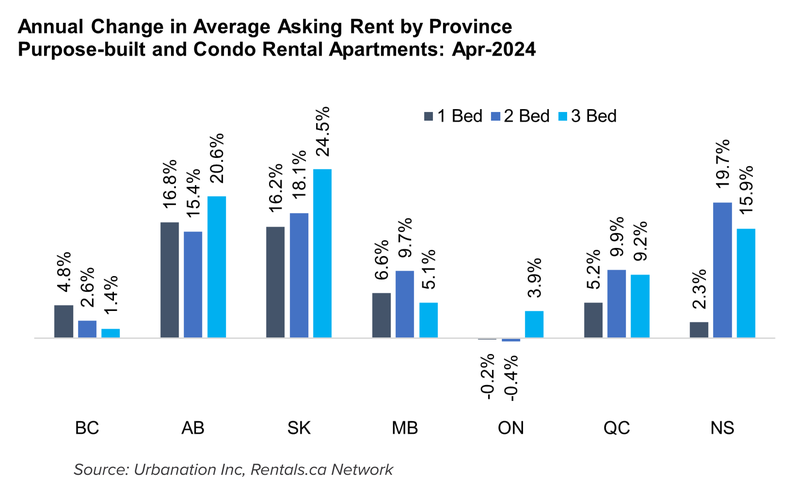
Rents Decrease in Ontario while Saskatchewan Becomes Provincial Leader for Rent Growth
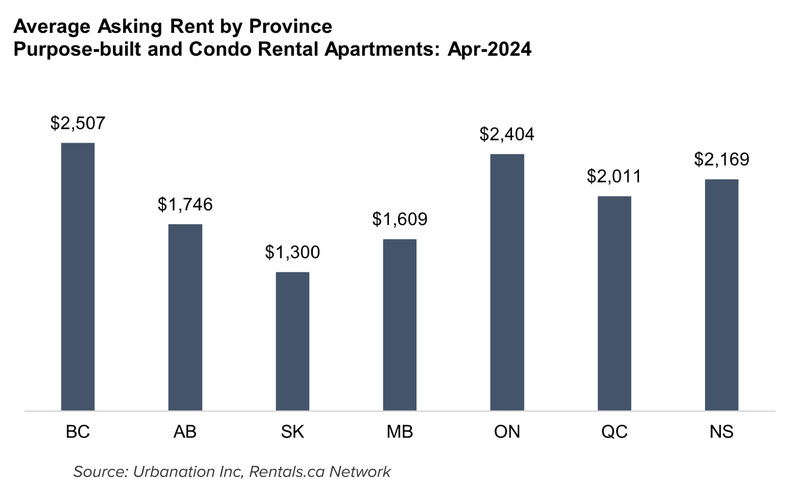
All provinces recorded month-over-month and year-over-year increases in asking rents for purpose-built and condominium apartments, except for Ontario where rents decreased -0.3% monthly and -0.7% annually to an average of $2,404. Saskatchewan overtook Alberta to become the provincial leader in annual rent growth in April, posting an 18.4% increase. Nonetheless, average asking rents for apartments in Saskatchewan remained the lowest in the country at $1,300. B.C. maintained its position as the province with the highest asking rents for apartments at an average of $2,507 in April, increasing just 1.6% from a year ago. This contrasted with a 16.4% annual growth for apartment rents in neighbouring Alberta, which reached an average of $1,746.
Rent declines in Ontario were focused on studio, one- and two-bedroom apartments, while three-bedroom apartment rents in Ontario increased 3.9% annually. In Alberta and Saskatchewan, rent increases were highest for three-bedroom apartments at 20.6% and 24.5%, respectively.
Municipal Overview
| Average Rent and Annual Change in Average Rent by Municipality for Apt. and Condo Listings: May 2024 | |||||||||||
| Average Rent | % Change Y/Y | ||||||||||
| RANK | CITY | TOTAL | 0B | 1B | 2B | 3B | TOTAL | 0B | 1B | 2B | 3B |
| 1 | North Vancouver, BC | $3,190 | $2,371 | $2,735 | $3,640 | $4,358 | -8% | -9% | -4% | -0.5% | 5% |
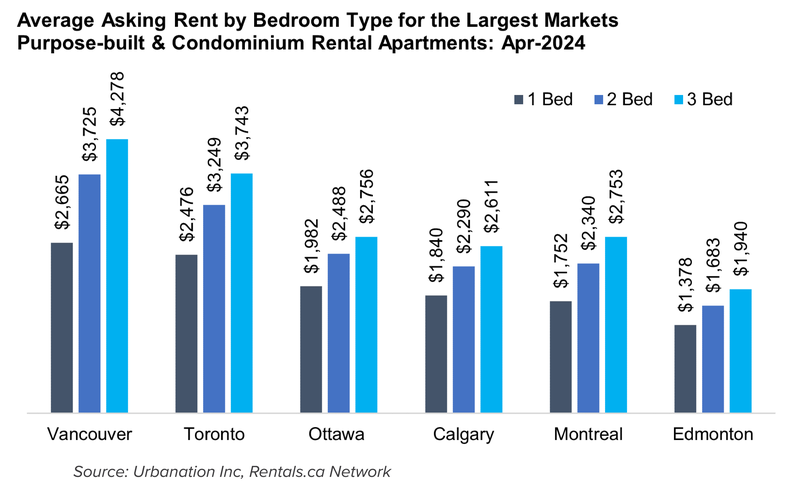
| 2 | Vancouver, BC | $2,982 | $2,299 | $2,665 | $3,725 | $4,278 | -8% | -7% | -6% | -2% | 3% |
| 3 | Toronto, ON | $2,757 | $2,008 | $2,476 | $3,249 | $3,743 | -2% | 1% | -2% | -2% | -1% |
| 4 | Mississauga, ON | $2,589 | $1,845 | $2,310 | $2,743 | $3,193 | 0% | -1% | 1% | -1% | 4% |
| 5 | Burlington, ON | $2,510 | $1,860 | $2,161 | $2,612 | $3,186 | -1% | ND | 0% | 3% | 3% |
| 6 | Brampton, ON | $2,493 | $1,663 | $2,242 | $2,535 | $3,072 | -3% | -12% | 4% | -3% | 4% |
| 7 | Scarborough, ON | $2,475 | $1,840 | $2,208 | $2,680 | ND | -3% | -7% | -2% | 2% | 3% |
| 8 | Guelph, ON | $2,330 | $1,778 | $2,146 | $2,503 | $2,719 | 0% | 20% | -8% | 4% | -23% |
| 9 | Victoria, BC | $2,306 | $1,809 | $2,115 | $2,784 | $3,583 | 5% | 4% | 5% | 9% | 4% |
| 10 | Waterloo, ON | $2,304 | ND | $2,055 | $2,478 | $2,858 | 19% | ND | 19% | 7% | 26% |
| 11 | Ottawa, ON | $2,159 | $1,611 | $1,982 | $2,488 | $2,756 | 3% | -2% | 2% | 4% | 10% |
| 12 | Halifax, NS | $2,149 | $1,605 | $1,887 | $2,437 | $2,773 | 8% | -6% | 1% | 17% | 10% |
| 13 | Kitchener, ON | $2,133 | $1,761 | $1,942 | $2,328 | $2,552 | -2% | -19% | 1% | -3% | 8% |
| 14 | Calgary, AB | $2,089 | $1,478 | $1,840 | $2,290 | $2,611 | 9% | 13% | 9% | 7% | 7% |
| 15 | Oshawa, ON | $2,082 | $1,624 | $1,849 | $2,146 | $2,462 | 4% | 15% | 0% | 1% | 3% |
| 16 | Kingston, ON | $2,064 | $1,398 | $1,806 | $2,262 | $2,217 | 7% | ND | 8% | 11% | -2% |
| 17 | Montreal, QC | $2,061 | $1,470 | $1,752 | $2,340 | $2,753 | 9% | 8% | 6% | 8% | 11% |
| 18 | Hamilton, ON | $2,028 | $1,464 | $1,861 | $2,218 | $2,819 | -4% | -2% | -3% | -4% | 18% |
| 19 | London, ON | $2,020 | $1,444 | $1,774 | $2,186 | $2,607 | 3% | 1% | 2% | 4% | 5% |
| 20 | St. Catharines, ON | $1,847 | $1,438 | $1,678 | $1,953 | $2,147 | 0% | 0% | -1% | 1% | 2% |
| 21 | Winnipeg, MB | $1,620 | $1,019 | $1,380 | $1,764 | $2,142 | 10% | -1% | 6% | 9% | 4% |
| 22 | Quebec City, QC | $1,544 | $902 | $1,294 | $1,671 | ND | 15% | -4% | 6% | 10% | 23% |
| 23 | Edmonton, AB | $1,514 | $1,079 | $1,378 | $1,683 | $1,940 | 13% | 15% | 16% | 11% | 18% |
| 24 | Regina, SK | $1,348 | $891 | $1,250 | $1,467 | ND | 18% | 6% | 15% | 10% | 20% |
| 25 | Saskatoon, SK | $1,323 | $1,010 | $1,217 | $1,403 | $1,714 | 13% | 15% | 9% | 14% | 14% |
| Source: Urbanation Inc., Rentals.ca Network data |
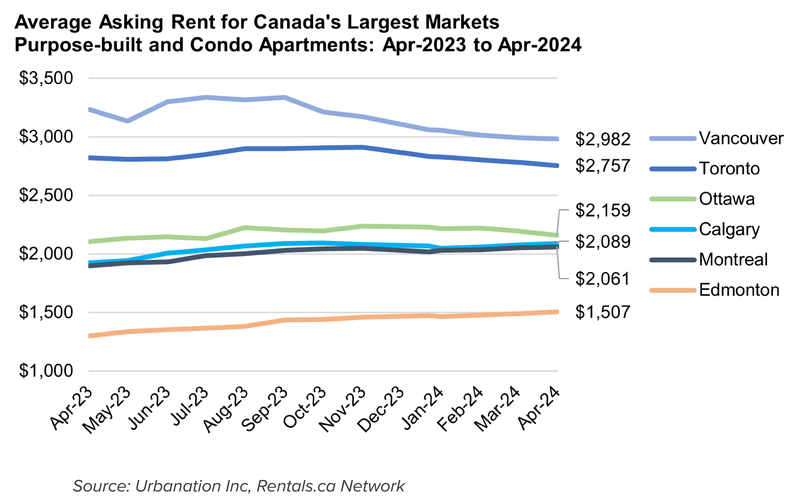
Vancouver Rents Down 11% Since July 2023
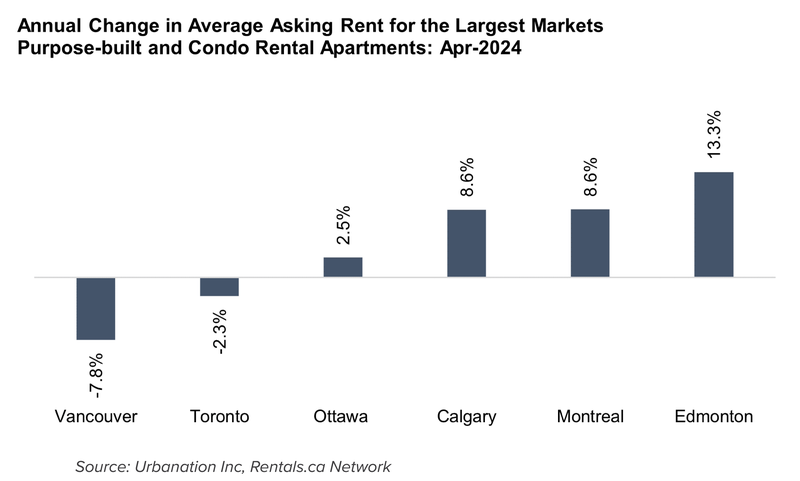
Average asking rents for apartments continued to fall in Vancouver and Toronto during April. Vancouver rents declined 0.4% month-over-month and 7.8% year-over-year to an average of $2,982, while Toronto rents were down 0.9% monthly and 2.3% annually to an average of $2,757. Apartment rents in Toronto have declined 5.4% from their peak in November 2023 ($2,913), while Vancouver rents have fallen 10.7% since reaching their high in July 2023 ($3,340).
Edmonton maintained its position as the leader for rent growth among Canada’s largest cities, with asking rents for apartments up 13.3% annually to an average of $1,507 — still well below average rent in Calgary, which rose 8.6% from a year ago to an average of $2,089. Apartment rents continued rising quickly in Montreal with an annual pace of 8.6% to reach an average of $2,061, while annual growth slowed to just 2.5% in Ottawa where rents averaged $2,159 in April.
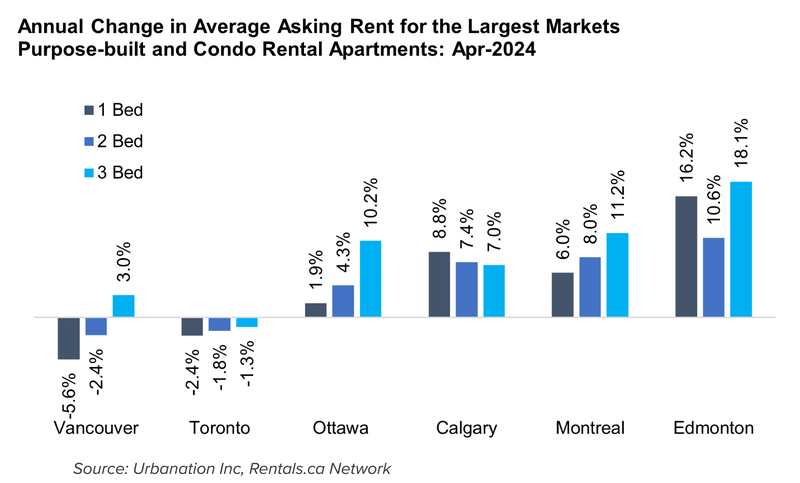
Vancouver rents declined the most for studios (-7.0%) and one-bedroom apartments (-5.6%), while increasing 3.0% annually for three-bedroom apartments. Asking rents in Toronto declined across all apartment types. In Ottawa, Montreal, and Edmonton, annual rent growth was strongest for three-bedroom apartments at 10.2%, 11.2%, and 18.1%, respectively.
Alberta Dominates List of Cities with Fastest Rising Rents
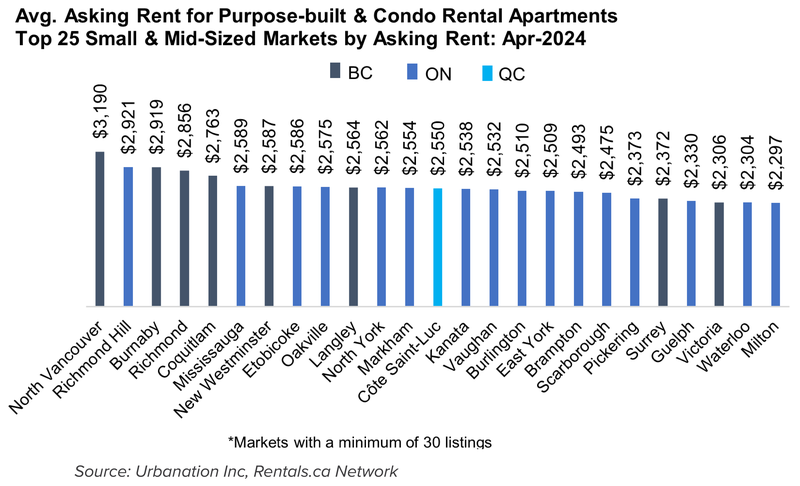
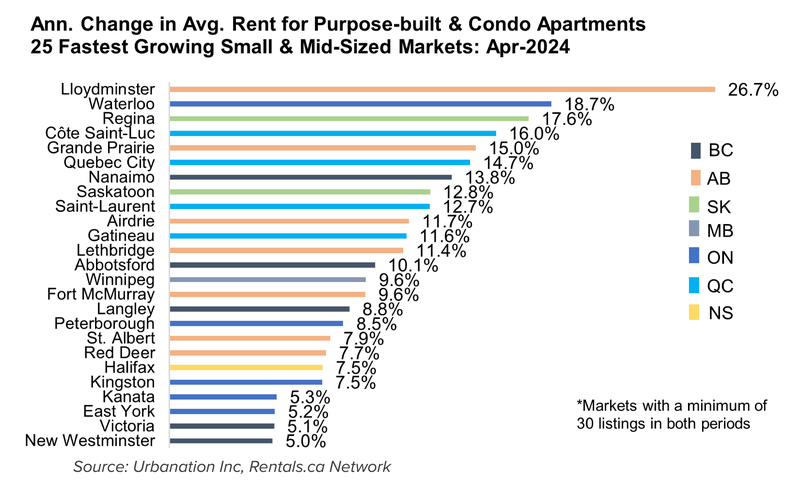
North Vancouver maintained its position as Canada’s most expensive rental market with asking rents for apartments averaging $3,190 in April, despite a 7.7% annual decline. Richmond Hill moved into second spot for the highest rents across small and mid-sized markets as asking rents for apartments reached an average of $2,921. The rest of the top five most expensive small and mid-sized markets were located in B.C., while Ontario had the highest number of cities taking up 16 spots in the top 25.
The City of Lloydminster, which straddles the provincial border between Alberta and Saskatchewan, posted the fastest annual rent growth in the country during April, with asking rents for apartments up 26.7% from a year ago yet maintaining a low average monthly cost of $1,122. Waterloo posted an 18.7% annual increase in asking rents for apartments, which reached an average of $2,304. Regina came in third for fastest rising rents in Canada with growth of 17.6% (rents averaging $1,348), with fourth spot going to Côte Saint-Luc in Quebec (+16.0% to $2,550) and fifth spot held by Grande Prairie, Alberta (+15.0% to $1,269). Overall, Alberta led the top 25 markets for fastest rising rents with seven cities making the list.
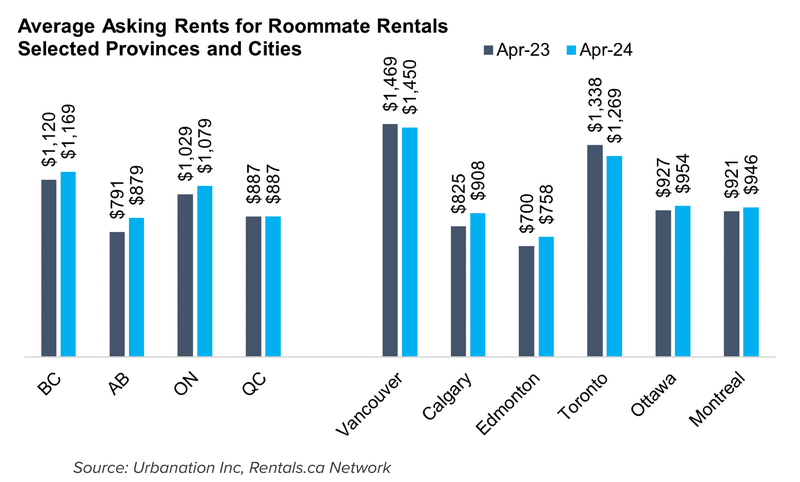
Alberta Leads Growth in Roommate Rents
Asking rents for shared accommodations increased 9% annually across the four provinces tracked for this type of rental, averaging $996 per month. In Alberta, roommate rents rose 11% year-over-year to $879, with Ontario roommate rents up 5% from a year ago to $1,079, and B.C. rents up 4% to an average of $1,169. In Quebec, asking rents for shared accommodations were unchanged from a year ago at an average of $887.
Toronto roommate rents declined 5% annually to an average of $1,269, while Vancouver rents for shared accommodations dipped 1% from a year ago to $1,450 — still the highest in the country. Meanwhile, asking rents for shared accommodations rose 10% annually in Calgary to an average of $908, and were up 8% year-over-year in Edmonton to an average of $758. Roommate rents in both Ottawa and Montreal increased 3% annually to an average of $954 and $946, respectively.
You can check out the previous rent reports here
Rentals.ca Data
The data used in this analysis is based on monthly listings from the Rentals.ca Network of Internet Listings Services (ILS). This data differs from the numbers collected and published by the Canada Mortgage Housing Corporation (CMHC).
The Rentals.ca Network of ILS’s data covers both the primary and secondary rental markets and includes basement apartments, rental apartments, condominium apartments, townhouses, semi-detached houses, and single-detached houses. CMHC’s primary rental data only includes purpose-built rental apartments and rental townhouses. CMHC also collects data on secondary market rentals, but this is reported separately.
CMHC’s rental rates are based on the entire universe of purpose-built rental units (rental stock), regardless of rental tenure. CMHC rental rates are reflective of what the average household spends on rental housing and not the current market rents for vacant units. The data used in this report is based on the asking rates of available (vacant) units only and reflect on-going trends in the market. This covers a smaller sample size but is more representative of the actual market rent a prospective tenant would encounter. The Rentals.ca Network of ILS’s data typically provides much higher rental rates compared to CMHC, as vacant units typically reset to market rates when not subject to rent control.
The average and median rental rates in this report can also skew higher than CMHC’s data for the following reasons: the inclusion of larger more expensive unit types such as single-family homes, townhouse units, and large luxury condominium units; the presence of duplicate or multiple listings at the same property and the survivorship bias where more expensive or over-priced units take longer to lease and remain in the sample longer.
Properties listed for greater than $5,000 per month, and less than $500 per month are removed from the sample. Similarly, short-term rentals, single-room rentals, and furnished suites are removed from the sample when identifiable.