

Rentals.ca’s latest Renter Feedback Survey for Winter 2025 reveals how conditions in the rental market are evolving. From affordability and rent increases to incentives and the challenges renters face when searching for a home, the recent survey highlighted key rental market challenges and trends. Key areas examined include affordability, the impact of rent increases, the effectiveness of incentives, and the specific difficulties Canadians encounter during their home search.
Affordability Pressures Remain Intense
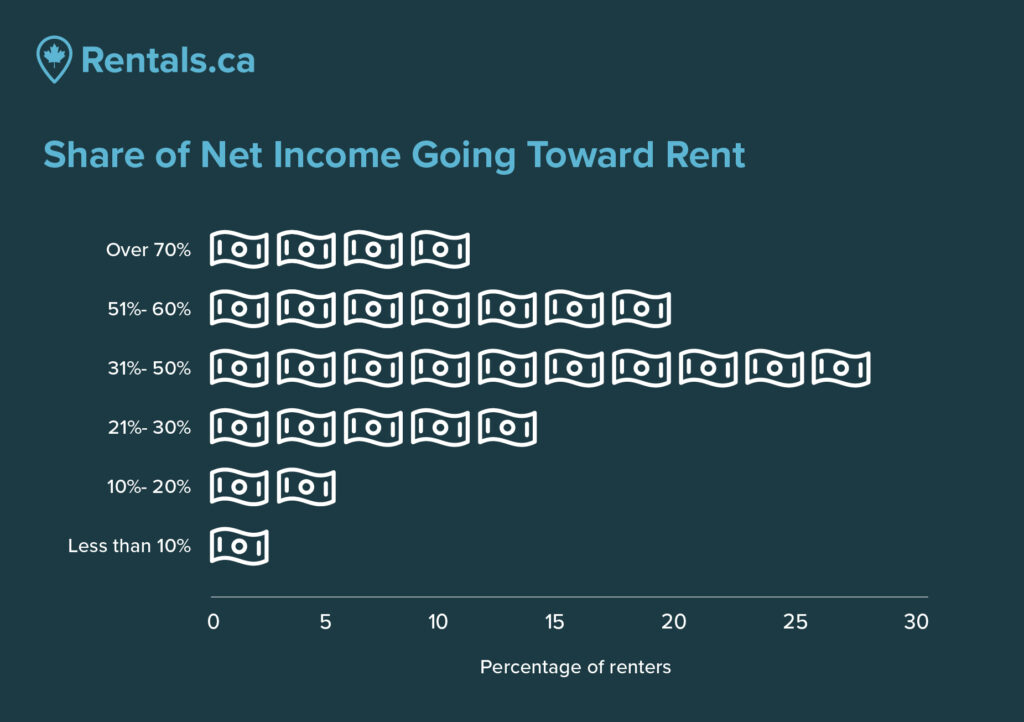
Affordability remains the primary concern for renters across Canada.
- 62% of renters say more than 30% of their net income goes toward rent
- 33% report spending more than 50% of their net income on rent
- 12% say they spend more than 70% of their net income on rent
Affordability pressures are even more pronounced in major urban markets. In Toronto, 70% of renters report spending more than 30% of their net income on rent, compared with 60% of renters in other markets.
Rent increases also add pressure for many renters across the country.
- 63% of renters report that their rent has increased since the summer
- 37% say their rent has not increased
Rent increases are being felt across both large cities and smaller markets, compounding affordability challenges for renters already dedicating a significant share of their income to housing.
High Rent Prices Dominate the Rental Search
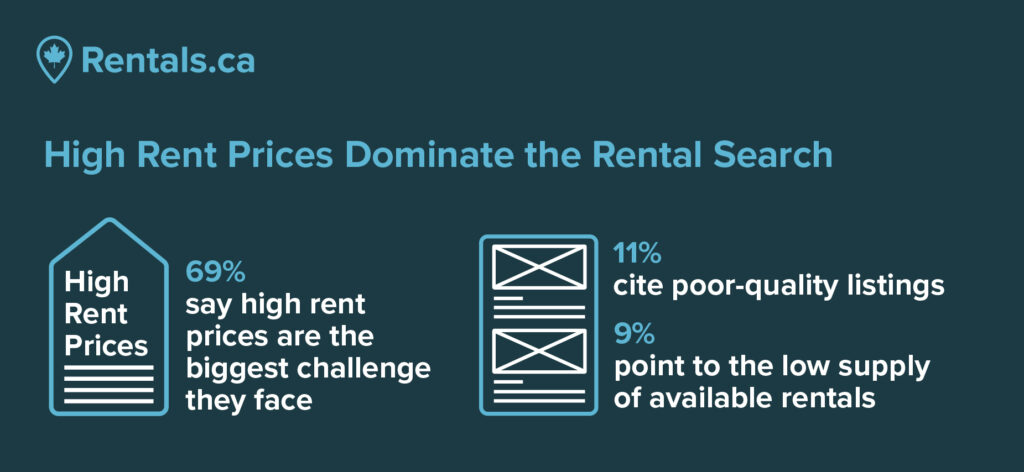
When asked about the biggest challenge in their rental search, renters overwhelmingly pointed to cost.
- 69% say high rent prices are the biggest challenge they face
- 11% cite poor-quality listings
- 9% point to the low supply of available rentals
- 4% say scams are their biggest concern
High rent prices ranked as the top challenge in every region, reinforcing that affordability is a national issue — not just a big-city problem.
How Much Income Renters Spend Varies by Age
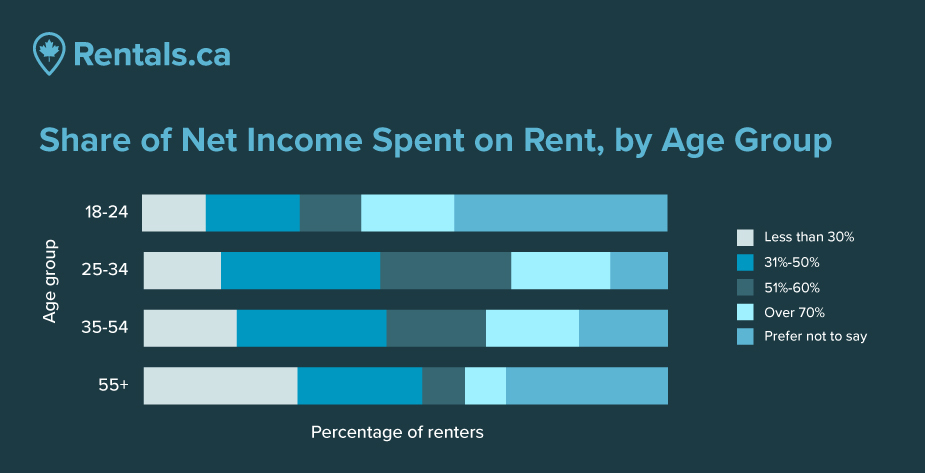
While renters across all age groups report affordability challenges, some groups are more affected than others.
- 43% of renters aged 25–34 say more than half of their net income goes toward rent
- Renters aged 35–54 show a similar pattern, with 37% also spending over half their income on housing
- Younger renters aged 18–24 are more likely to report very high income shares going toward rent.
These age-based patterns appear across regions, suggesting that high housing costs are affecting renters at multiple life stages, regardless of location.
What Renters Say They Can Afford
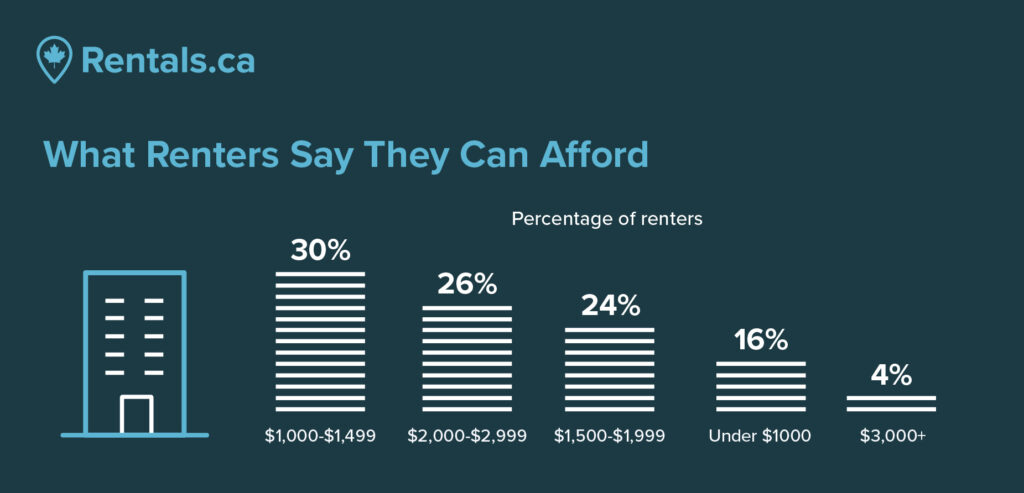
When asked about their budget for their next rental, most renters reported price ranges below prevailing asking rents in many markets.
- 30% of renters say their budget is between $1,000 and $1,499
- 26% report a budget of $2,000 to $2,999
- 24% say they can afford $1,500 to $1,999
- 16% say their budget is under $1,000
- Only 4% say they are budgeting $3,000 or more
Taken together, 70% of renters say their budget for their next rental is under $2,000. However, budgets vary by region. Renters looking to rent in Toronto are more likely to report budgets in the $1,500 to $3,000 range, while renters targeting Vancouver show a more polarized pattern, with many reporting budgets that fall well below prevailing asking rents.
Move-In Incentives Matter More Than Ever
As rents rise, incentives are playing an increasingly important role in renter decision-making.
- 58% of renters say move-in incentives, such as free rent periods, are very important
- 17% say incentives are somewhat important
- 15% feel neutral
- 11% say incentives are not important
In higher-cost markets like Toronto, renters are especially likely to view incentives as essential to making a move financially feasible.
The findings in this survey are based on responses from 503 renters across Canada. The margin of error for the total sample is ±4.4% at a 95% confidence level, meaning that if the survey were conducted multiple times, the results would fall within this range 95% of the time. Percentages shown throughout are based on valid responses to each question; totals may vary due to non-response.

Rentals.ca is Canada’s premier online marketplace for renters and landlords, providing a comprehensive suite of tools and resources tailored to simplify the rental process. With an extensive selection of listings across the country, Rentals.ca offers user-friendly search functionality that helps renters find their perfect home efficiently. For landlords, Rentals.ca delivers effective advertising solutions to maximize visibility and fill vacancies faster. Committed to innovation and excellence, Rentals.ca aims to empower users with up-to-date market insights and expert guidance, making renting easier and more accessible for everyone.