

The average rent for all property types across Canada in August 2021 was $1,763 per month, representing an annual decrease of 0.3%. The average rent is up 0.6% monthly, and 5.2% from the recent market low of $1,675 per month in April of this year.
Rentals.ca September 2021 Rent Report
1. National Overview
The chart below shows the average monthly rent for single-family housing, townhouses, apartments, condominium apartments, and basement apartments cumulatively from January 2020 to August 2021 (red line, right axis), with the annual change in average rent below (grey bars, left axis).
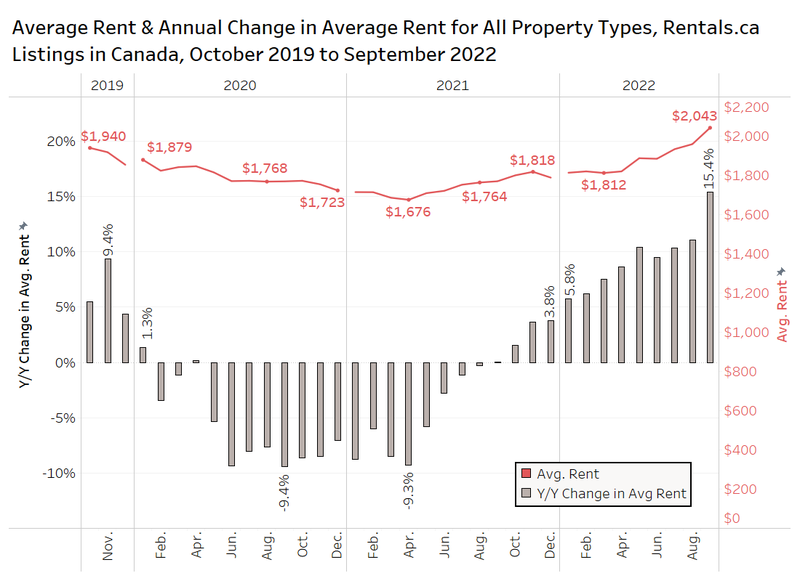 Heading into the latter half of the year, rents are expected to continue to rise as university and college classes resume and as office towers re-open with a partial return to normalcy for many industries that require in-person employment.
Average Rent by Property Type and Month
The chart below shows the average rent for single-family homes, condominium apartments and rental apartments in August of 2019, 2020 and 2021.
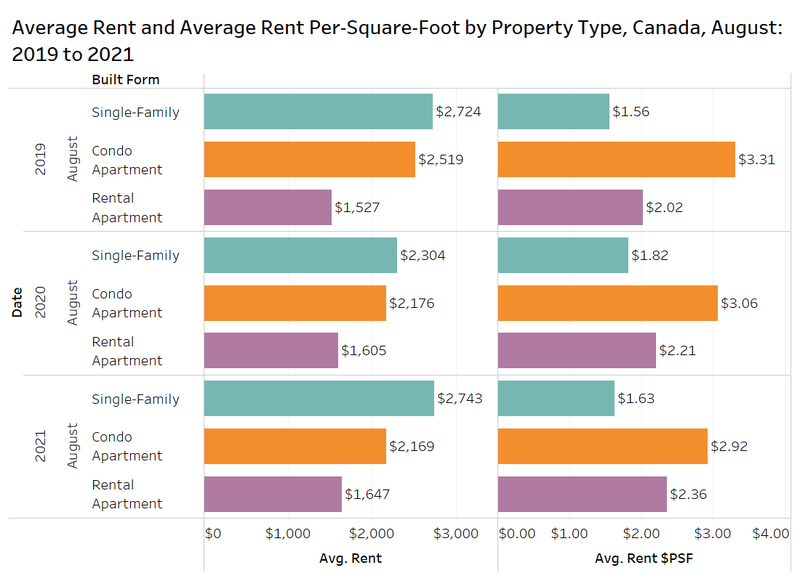 The average rent for single-family homes in August 2021 was $2,743 per month, which is higher than the average rental rate for single-family homes in August 2019. After a decline of 15% in August 2020, the average rental rates increased 19% this year.
The average rent for condo apartments has declined in 2020 and 2021, moving from $2,519 per month down to $2,169 per month, annual declines of 13.6% and 0.3%, respectively. Despite the pandemic, the average rent for purpose-built rental apartments has steadily increased between 2019 to 2020, moving from $1,527 per month up to $1,647 per month, annual increases of 5.0% and 2.6%, respectively.
The average rent per square foot for condo apartments gradually declined, moving from $3.31 per square foot (psf) in August 2019 to $2.92 psf in August 2021. While the opposite occurred for rental apartments, moving from $2.02 psf in August 2019 to $2.36 psf in August 2021.
Average Rent by Bedroom Type
The next chart presents data on the average rent by bedroom type for all property types in Canada based on Rentals.ca listings.
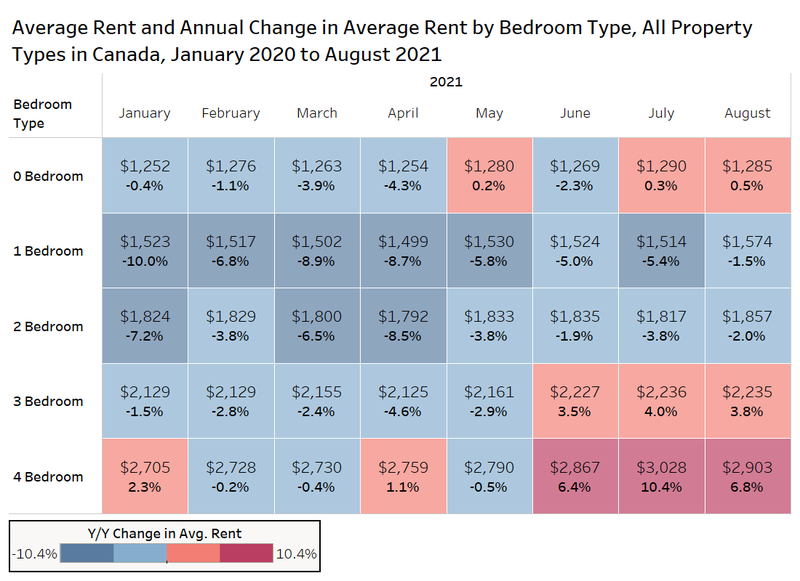 Studio units had an average rental rate of $1,285 per month in August, representing an annual increase of 0.5%. One-bedroom units had an average rental rate of $1,574 per month, representing an annual decrease of 1.5%. Two-bedroom units had an average rental rate of $1,857 per month, representing an annual decrease of 2%. Three-bedroom units had an average rental rate of $2,235 per month, representing an annual increase of 3.8%. Four-bedroom units had an average rental rate of $2,903 per month, representing an average increase of 6.8%.
As has been the trend throughout the pandemic, there is a clear preference for larger units with strong annual rent growth in each of the last three months for three- and four-bedroom rental properties. However, there is clearly a recovery occurring for smaller suites, with the average one-bedroom unit now $75 per month more expensive than the average in April of this year.
2. Provincial Rental Rates
The map below shows the average rent for all property types by province in Canada. The bottom panel in the chart below presents data on the average rent in August 2020 and August 2021, as well as the annual change in rent.
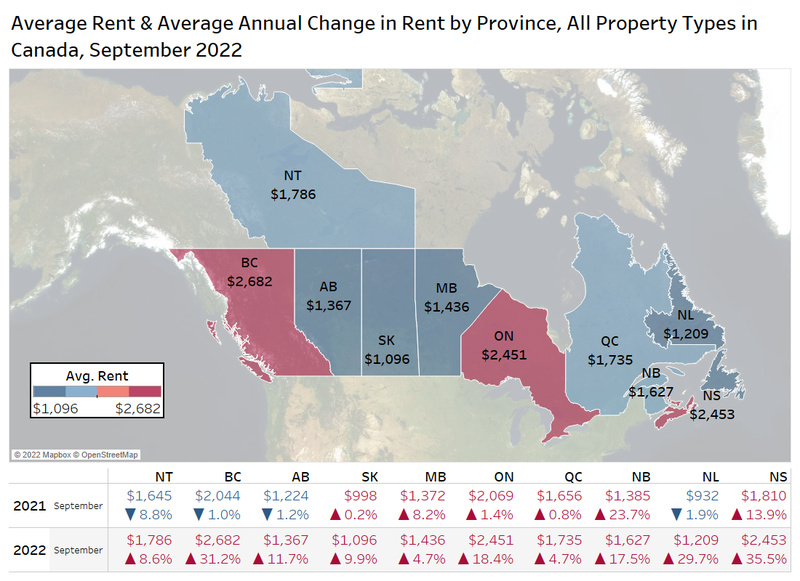 British Columbia was the province with the highest average rental rate at $2,084 per month in August after experiencing an annual increase of 4.2% — despite the pandemic, BC rents increased 5.7% a year earlier. Ontario followed closely behind, with an average rental rate of $2,045 per month, representing a year-over-year decline of 1.2% — rents in August of 2020 were down 10.8% annually.
Rental rates in Alberta dropped 6.6% annually in August of 2020, but have increased this year by 0.2%. Quebec rents fehad ll by over 15% last year, but are up 2% annually as of August 2021.
The sample of listings is not consistent year over year, and the composition of the sample often contributes to the monthly and annual volatility of the average rent, and therefore data for the smaller provinces in Canada can have much wider annual movements.
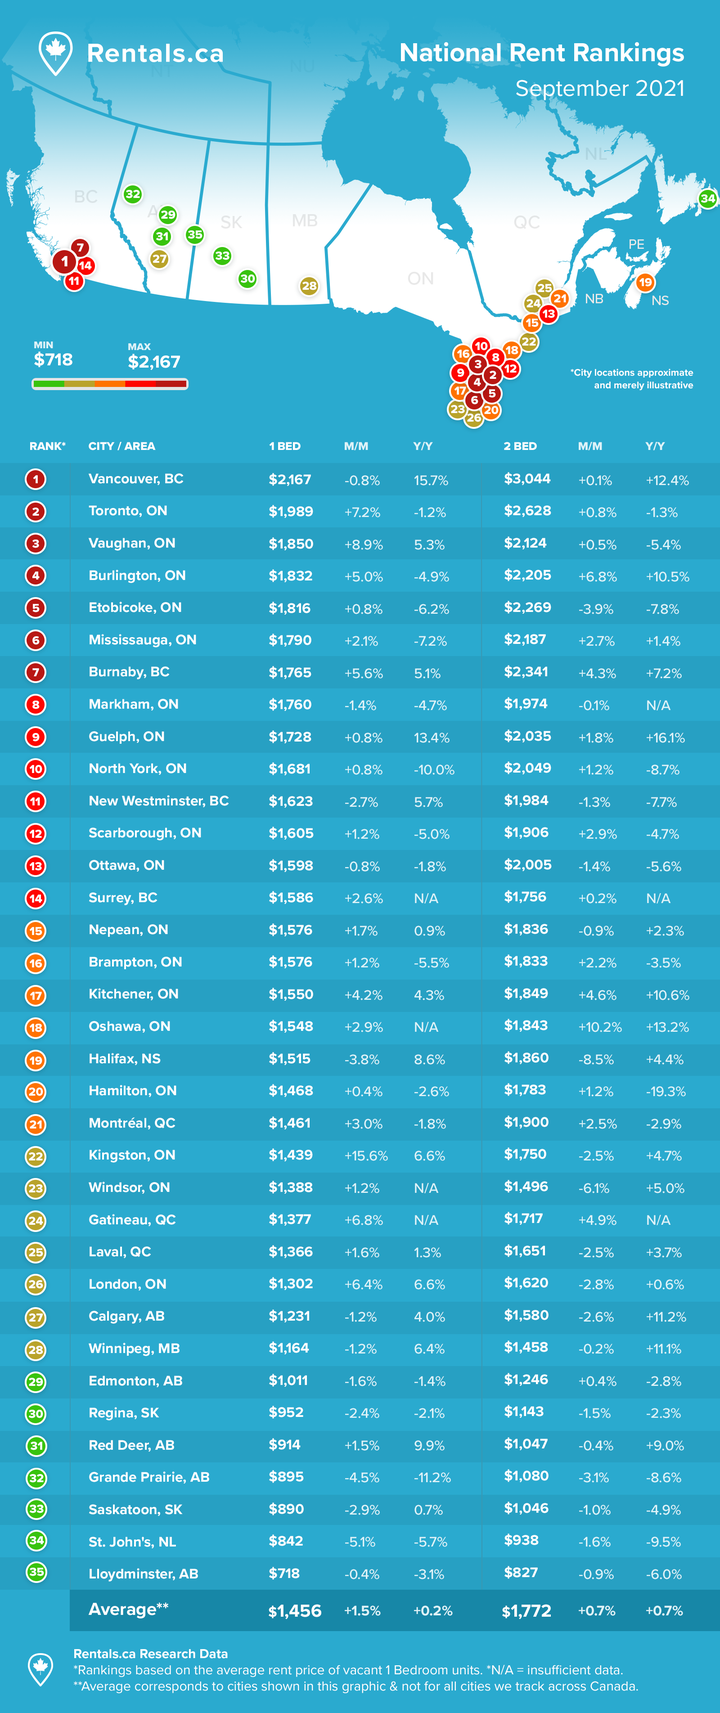
3. Municipal Rental Rates
Ranking of Municipalities (and former municipalities) by Rentals.ca Pageviews
What are the most popular cities in Canada on Rentals.ca? The chart below ranks these municipalities and former municipalities based on online pageviews.
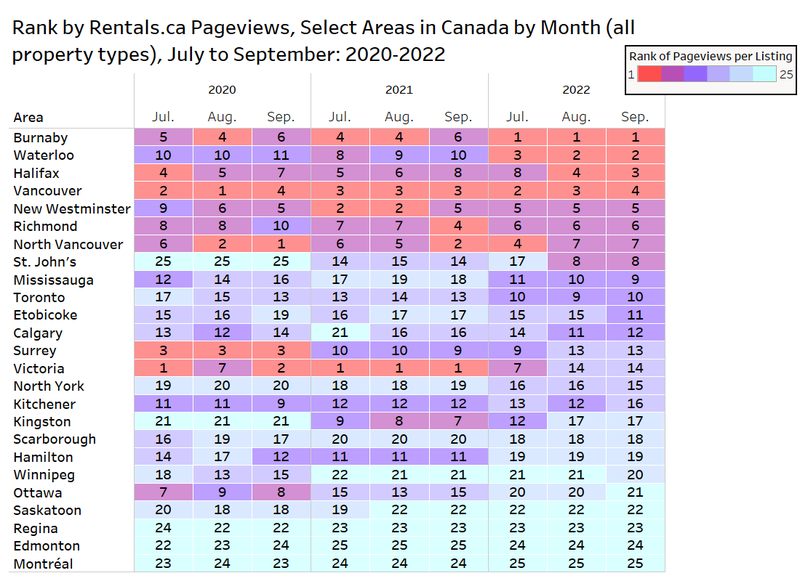 In 2021, the top four ranked municipalities by page views have stayed relatively consistent, being made up of some combination of Toronto, Ottawa, Montreal, and Vancouver (with Toronto first and Ottawa second). North York, Edmonton, and Calgary generally landed in the five, six, and seven ranks. Ranks eight through 10 were typically made up by some combination of Etobicoke, Winnipeg, Mississauga, and London.
In general, Etobicoke and Winnipeg are the municipalities that experienced the largest rise up the ranks. Etobicoke was ranked as low as 13th in 2020 during the worst of the pandemic lockdowns, before reaching a rank of eighth in August 2021. Winnipeg was ranked as low as 17th in 2020, before reaching a rank of ninth in August 2021. Hamilton was much more popular in the fall of last year (as high as eighth) than it has been in 2021, falling to 13th place in August.
Municipal Rental Rates (includes former municipalities in Toronto, pre-amalgamation)
The chart below presents data on the average rental apartment and condominium apartment rental rates by municipality and area in Canada for August 2021, with the annual per cent change in average rent shown on the right (includes former municipalities prior to amalgamation in Toronto).
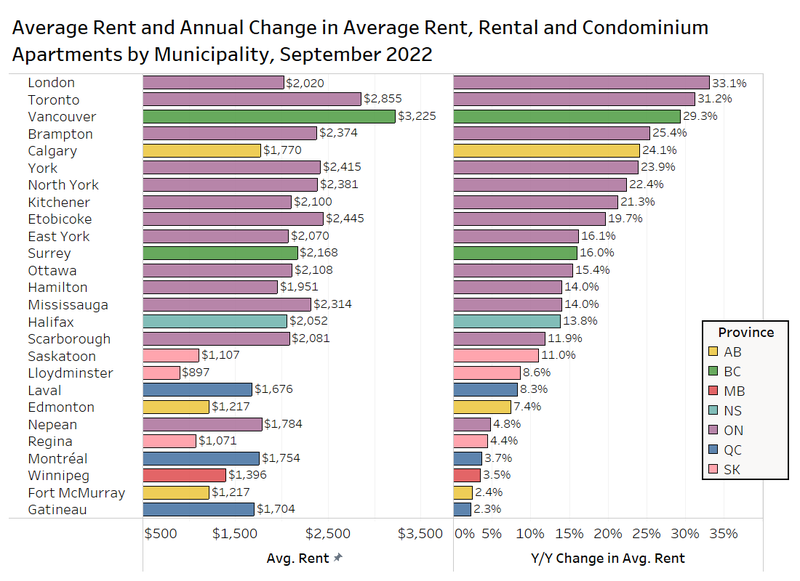 Vancouver had both the highest average rental rate at $2,559 per month and the highest year-over-year increase in average rent at 14.2%.
Calgary and Kitchener also experienced significant year-over-year increases in average rental rates, increasing by 8% and 7.7% respectively. Some of the jump in Calgary can be attributed to a shift in listings, despite the substantial sample size, there are more centrally located listings available, pulling the average up.
North York experienced the largest year-over-year decline in average rent, decreasing 8.2% to $1,912 per month. Etobicoke and Scarborough experienced similar levels of year-over-year decreases, both declining 5% annually. These ‘outer 416-area-code’ municipalities suffered from the decoupling of work from the physical office location.
Condo Rental Rates by Municipality
As shown in previous reports, the condo investor rental market was hit hard during the pandemic, with many private landlords forced to significantly drop their rents to secure a tenant as opposed to institutional owners that offered big incentives, or simply chose to wait out the downturn, having a greater financial buffer to do so.
The average rental rate for condo apartments in Edmonton steadily declined through 2020 and 2021, landing at $1,410 per month in August 2021. Edmonton appears to be unique in that the average rent did not experience the same fluctuations that other municipalities experienced during the pandemic.
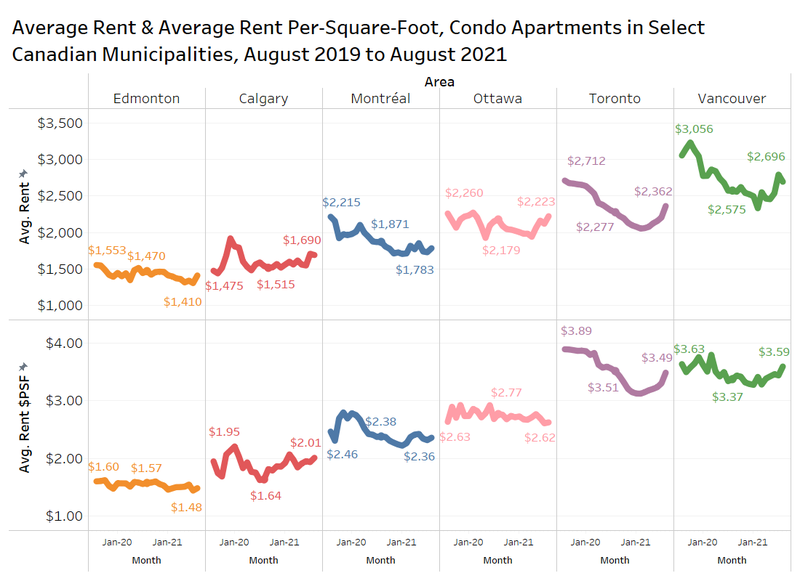 In Calgary, the average rental rate experienced a sudden increase toward the end of 2019, before returning to the previous levels in early 2020. Throughout 2020 and 2021, the average rental rate gradually increased, settling at $1,690 per month in August 2021.
Montreal has seen its average rental rate steadily decrease throughout 2020, before experiencing some small increases in early 2021. Since August 2019, the average rent in Montreal has declined 19.5%, which is the largest decrease experienced out of the selected municipalities. That said, the decline in the rent per square foot was much less steep, suggesting that some of the decline can be attributed to a change in the unit sizes for rent in the market (919 psf average in August 2019, 783 psf average in August 2021).
The average rent in Ottawa, despite experiencing some clear fluctuations throughout the last two years, has not changed significantly between August 2019 and August 2021, declining only 1.6% from $2,260 per month to $2,223 per month.
The average rent in Toronto experienced significant declines since 2019, falling by about $650 from market peak to trough. The condo rental market has recovered in recent months, rising by a whopping 7.2% month over month to $2,362 in August 2021, and 15% since the February low.
Similar to Toronto, the average rental rate in Vancouver experienced significant declines through 2020 before recovering in 2021 to $2,696 per month, which is up 16% since the February low of $2,332 per month.
Ottawa Rents by Property Type
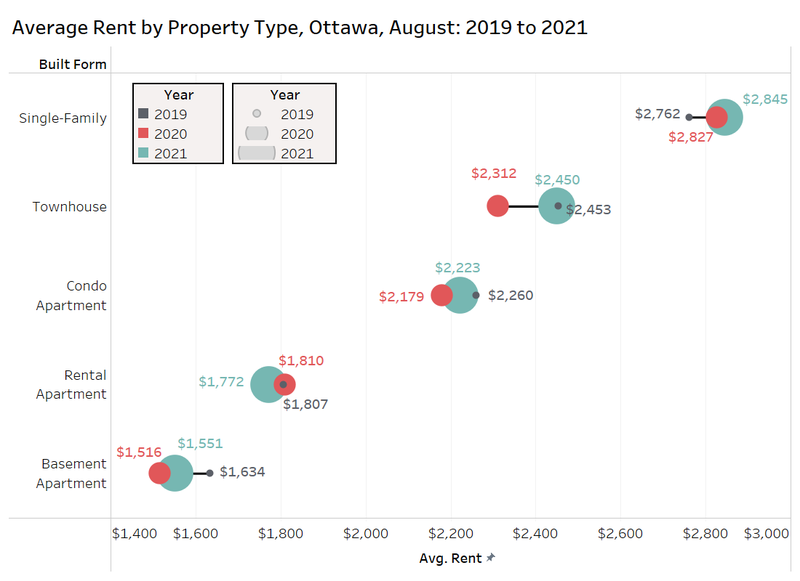
The chart below looks at the change in the average rent by property type in Ottawa from August 2019 (black) to August 2020(red) to August 2021 (teal).
Single-family homes in Ottawa were the only property type to consistently experience increases each year since 2019, moving from $2,762 per month in 2019, to $2,827 per month in 2020, to $2,845 per month in 2021.
Townhouses, condo apartments, and basement apartments generally had higher average rental rates in 2019 than both 2020 and 2021 (albeit to varying degrees).
The average rent for rental apartments is the only property type with a lower average rental rate in 2021 than that of 2020: $1,772 per month in August 2021, down from $1,810 in August 2020 and $1,807 per month in August 2019.
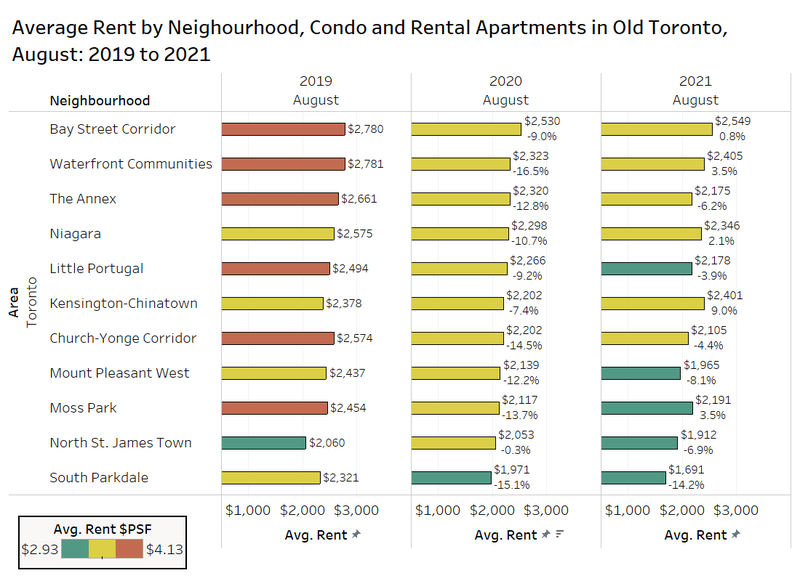
 Toronto Rents by Neighourhood
In Toronto, the Bay Street Corridor remains one of the most expensive neighbourhoods in Toronto in August 2021, along with Waterfront Communities and Kensington-Chinatown. Kensington-Chinatown is also the neighbourhood that has experienced the largest year-over-year increase at 9%.
Some of the more inexpensive neighbourhoods in terms of monthly rental rates include South Parkdale, North St. James Town, and Mount Pleasant West. In particular, the average rental rate in South Parkdale has declined 14.2% annually to $1,691 per month.
4. Conclusion
The average rent across Canada continues to show signs of recovery, moving from a low of $1,675 per month earlier in the year to $1,763 per month in August. Year-over-year change rates have moved from -9.3% in April to -0.3% in August 2021, further suggesting that the rental rates are slowly recovering.
Single-family homes in particular have bounced back strong, sporting a higher average rental rate in August 2021 than in 2019. Condo apartments continue their slow and gradual decline, while rental apartments continue their equally slow and gradual increase year over year. With that said, it is only a matter of time before condo rental rates turn positive on a national basis, as condo rental rates are up 15% and 16% from February 2021 to August 2021 in Toronto and Vancouver, respectively.
As previously mentioned, one- and two-bedroom units have experienced year-over-year declines, while larger units with three or four bedrooms have experienced significant year-over-year increases, suggesting that the demand for larger units persists and that some tenants fully expect that working from home will be a requirement for the foreseeable future.
As the country attempts to return to normal, the average rent in many major municipalities (i.e. Toronto, Vancouver etc.) have shown signs of recovery, hitting lows earlier this year before showing significant increases in recent months.
We will continue to monitor the data to understand if there is increased demand for downtown properties, or a further increase in demand for larger suburban properties.
Rentals.ca Data
The data used in this analysis is based on monthly listings from Rentals.ca. The data is much different than the more familiar numbers collected and published by Canada Mortgage Housing Corporation (CMHC).
Rentals.ca data includes basement apartments, rental apartments, condominium apartments, townhouses, semi-detached houses and single-detached houses, where CMHC’s primary rental data only includes rental apartments and rental townhouses. CMHC collects some data on the secondary market, but it is reported separately.
The CMHC rental rates are based on the entire universe of purpose-built rental units in Canada (the stock), while Rentals.ca data is primarily based on the asking rents of vacated units only (the flow) — this is a smaller sample size, but more representative of the actual market rent a prospective tenant encounters. The Rentals.ca data set typically produces much higher rental rates in comparison to CMHC, as vacated units are not subject to rent control.
The average and median rental rates via Rentals.ca can also skew higher than CMHC’s data for several reasons: The inclusion of larger and more expensive unit types like singles, row units and condos; the survivorship bias (overpriced units remain in the sample longer); and the multiple listings of the same property at different rent levels every month.
It should also be noted that properties listed for above $5,000 a month and below $500 a month are eliminated from the sample of units analyzed. Also, short-term leases, single-room rentals, and furnished rental units are eliminated from the sample where identifiable.

Rentals.ca is Canada’s premier online marketplace for renters and landlords, providing a comprehensive suite of tools and resources tailored to simplify the rental process. With an extensive selection of listings across the country, Rentals.ca offers user-friendly search functionality that helps renters find their perfect home efficiently. For landlords, Rentals.ca delivers effective advertising solutions to maximize visibility and fill vacancies faster. Committed to innovation and excellence, Rentals.ca aims to empower users with up-to-date market insights and expert guidance, making renting easier and more accessible for everyone.