

Rentals.ca October 2021 Rent Report
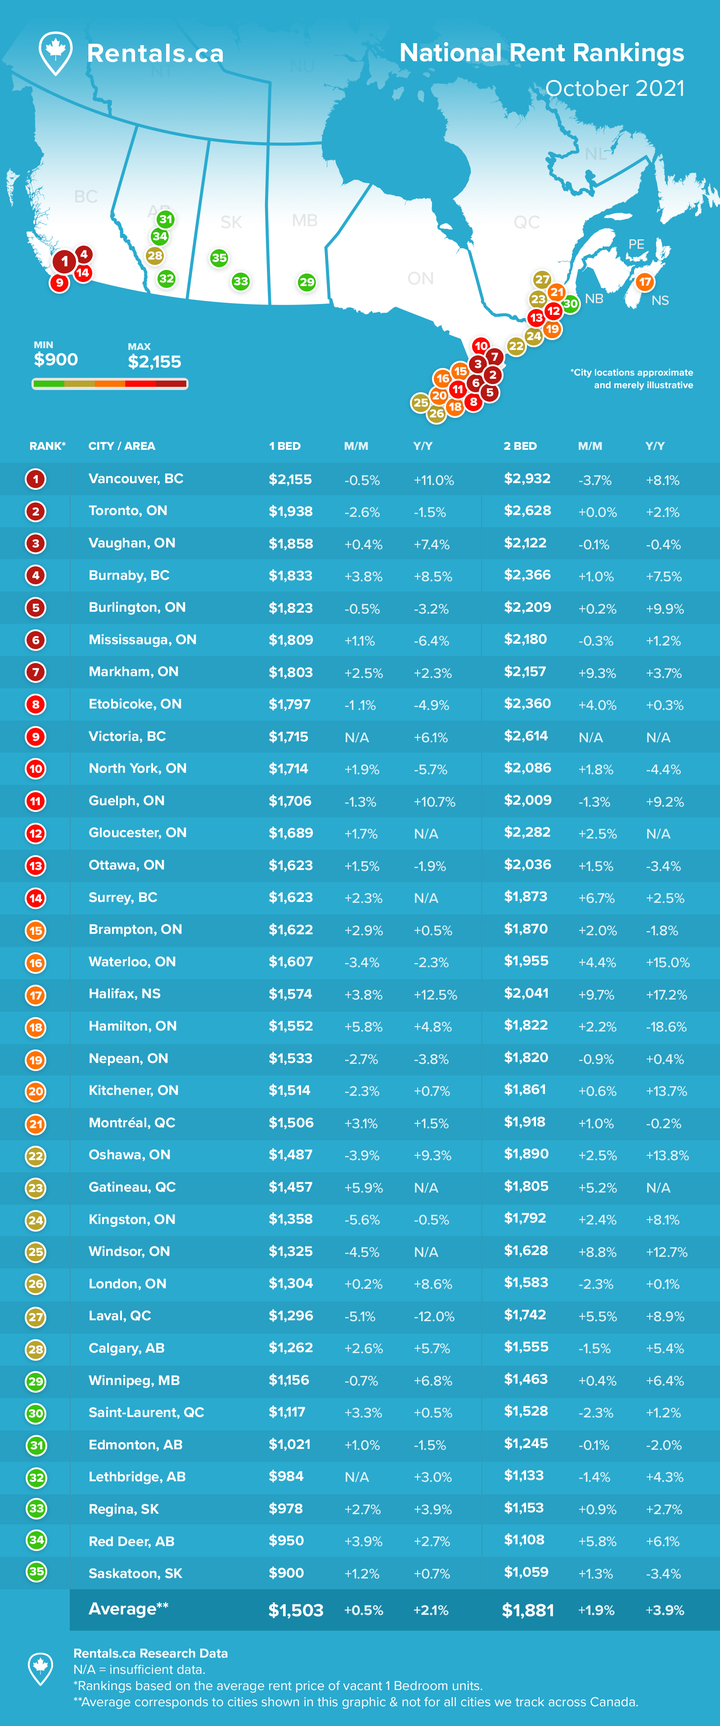
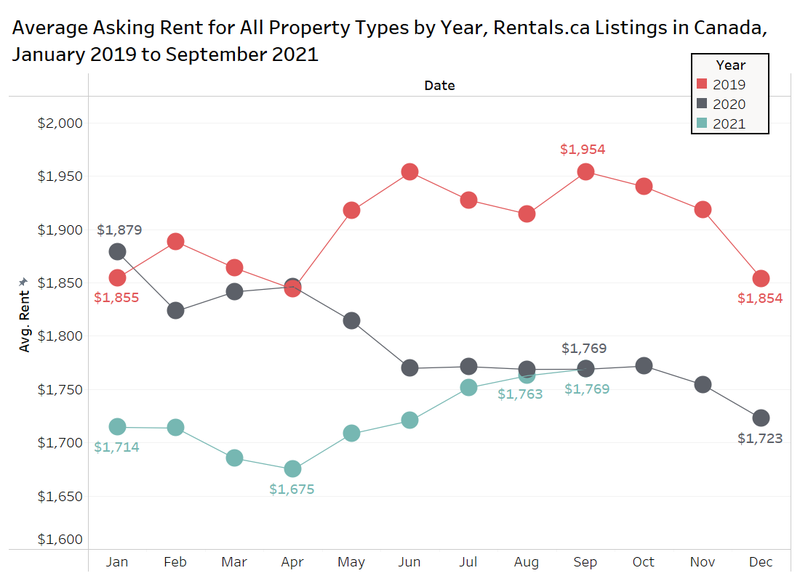
The average rent for all Canadian properties listed on Rentals.ca in September 2021 was $1,769 per month, identical to the September 2020 figure and up 0.3% over August of this year. The average rent has been slowly increasing month over month after hitting a multi-year low of $1,675 per month in April 2021.
Rentals.ca October 2021 Rent Report
1. National Overview
The chart below shows the average monthly asking rent for single-family housing, townhouses, rental apartments, condominium apartments, and basement apartments cumulatively from January to September of this year and for all 12 months in 2020 and 2019. The September 2021 average rent is 9.5% less than the same month two years earlier.
 Quarterly Rents by Bedroom Type
September marked the end of the third quarter, and looking at trends on a quarterly basis can eliminate some of the volatility with the smaller monthly sample sizes.
The next chart looks at the average rent and average rent per square foot for all property types by the number of bedrooms (one-bedroom to four-bedroom units only) from Q3-2019 to Q3-2021.
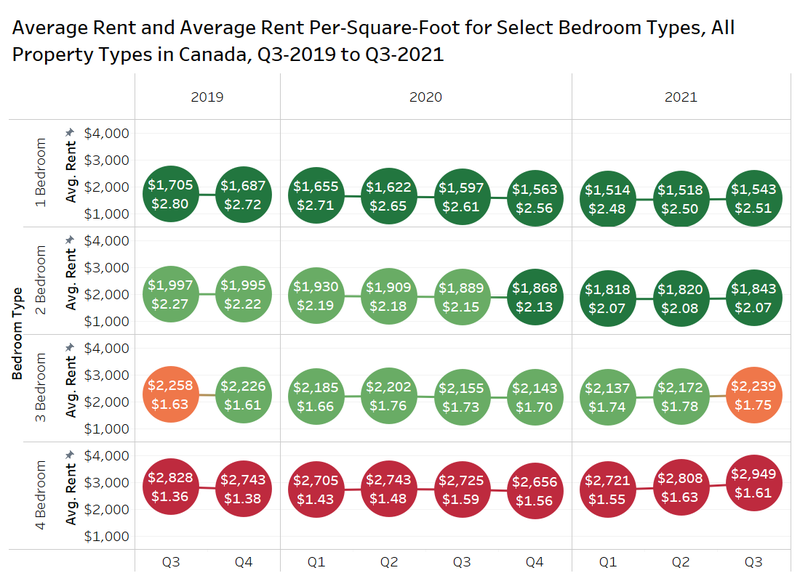 On an annual basis, average monthly rent is down for one- and two-bedroom units, but up for three- and four-bedroom units. One-bedroom suites fell 3.4% annually to $1,543 in Q3-2021. Two-bedroom units fell by 2.4% year over year to $1,843 per month.
Three-bedroom units in the third quarter increased from $2,155 per month in Q2-2020 to $2,239 per month in Q2-2021, a 3.9% increase year over year. Four-bedroom homes saw an annual increase of 8.2% annually, moving from $2,725 to $2,949 in Q3-2021.
Quarter over quarter, four-bedroom units experienced the largest change, increasing 5% from the Q2-2021 average of $2,808 per month. Three-bedroom units experienced a quarter-over-quarter increase of 3.1%, while two-bedroom and one-bedroom units experienced quarterly increases of less than 2%.
Change in Rent by Rounded Unit Size and Property Type
With many tenants seeking more space due to working from home, it is worth looking at whether that factor is still impacting rental rates by unit size. To better isolate the impact of a unit’s square footage, delineating the data by property type is required.
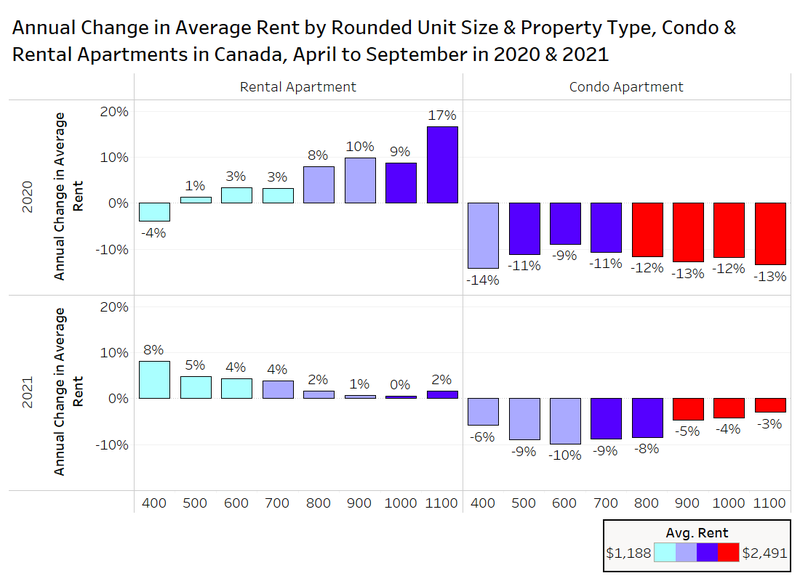
The chart below looks at the annual change in average rent for condominium and rental apartments by rounded unit size (rounded to the nearest hundred) for the pandemic period of April to September 2020 versus the same six months in 2021 (outlier sizes were eliminated).
 The data is very different for condo apartments verus rental apartments, as the annual changes in average rent paint different pictures.
In 2020, the average rent for larger rental apartments sharply increased, as the average rent for smaller apartments either decreased or experienced little change. In 2021, the average rent for larger apartments remained about the same, while the average rents for smaller apartments started to increase. This supports the common narrative of larger units being more in demand during the pandemic as society began to work from home, but as the economy rebounds and students return to school, the demand for small units has increased.
Condo apartments on the other hand, experienced heavy annual declines in average rent across all unit sizes in 2020. While the average rent is lower on average in 2021 compared to 2020, the severity of the declines has started to vary by unit size with smaller units experiencing higher levels of decline compared to larger units.
2. Provincial Rental Rates
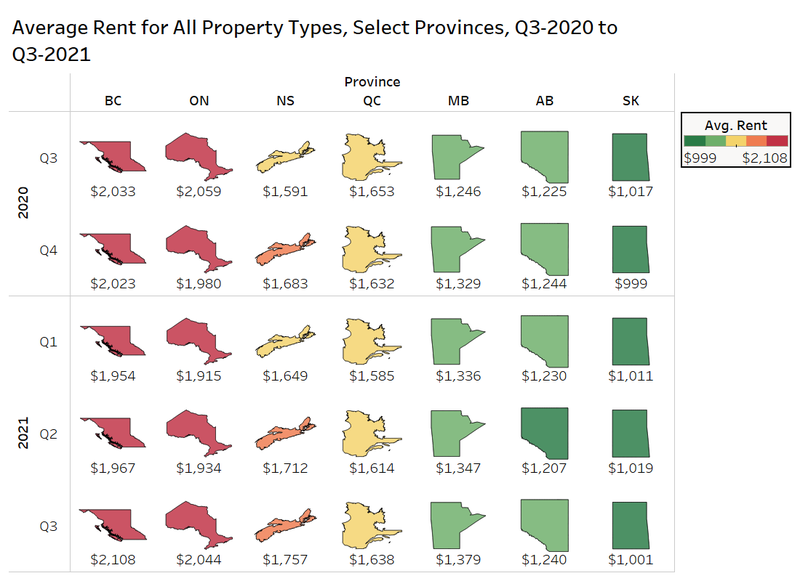
The chart below looks at the average rent for all property types by quarter over the past year for select provinces in Canada.
British Columbia had an average rent of $2,108 per month in Q3-2021, edging out Ontario ($2,044) for the highest average rents. British Columbia experienced the highest quarter-over-quarter change in average rent, increasing 7.2% from $1,967 per month to $2,108 per month. This is followed closely by Ontario, which experienced an increase of 5.7% to $2,044 per month.
Saskatchewan is the only province that experienced a decline of 1.8%, moving from $1,019 per month to $1,001 per month.
Nova Scotia, Manitoba, and Alberta all experienced a quarterly increase of around 2.5% in Q3-2021, while Quebec experienced a quarterly increase of 1.5%.
On an annual basis, British Columbia has experienced a 3.7% increase from the Q3-2020 average rental rate of $2,033 per month. Ontario, on the other hand, has experienced a slight decline of 1% from the Q3-2020 average rental rate of $2,059 per month.
Nova Scotia and Manitoba both experienced high levels of annual growth in Q3-2021, increasing by over 10% year over year. It has been reported that there has been a significant number of Ontario residents moving to Nova Scotia and remaining with their Ontario employers, intending to make work-from-home permanent. This flood of demand has spiked rental rates, leading to rents being over $160 more per month than one year ago.
3. Municipal Rental Rates
Municipal Rental Rates for All Property Types by Quarter
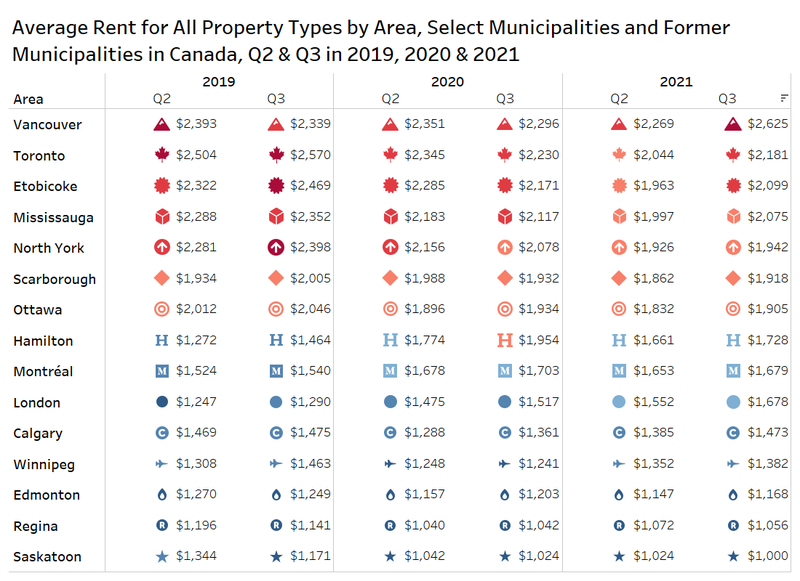
The chart below looks at the average rent for all property types by quarter in the second and third quarters of 2019, 2020 and 2021.
Data shows that the most expensive market again is Vancouver, with an average rent rate of $2,625 per month in Q3-2021, which represents an annual increase of 14.3%. The average rent in Vancouver also increased by 15.7% quarter over quarter from the Q2-2021 average of $2,269 per month.
Toronto is the next most expensive area, with an average rental rate of $2,181 per month in Q3-2021. This represents an annual decrease of 2.3% from the Q3-2020 average rent of $2,230 per month. On a quarterly basis, this also represents an increase of 6.7% from the Q2-2021 average rental rate of $2,044 per month.
 Municipal Rental Rates Per Square Foot
The chart below looks at the average rent per square foot over the last two years in Vancouver, Calgary, Toronto and Montreal for condominium and rental apartments.
After several months of steady increases in Toronto and Vancouver, per-square-foot rental rates in September experienced declines. The average rent per square foot (psf) in Toronto moved from $3.41 psf to $3.27 psf, which represents a month-over-month decline of 4.1%, while the average rent per square foot in Vancouver moved from $3.76 psf to $3.57 psf, a monthly decline of 5%. One explanation for this is that smaller units typically have higher rents on a per-square-foot basis, and the data shows fewer smaller units listed on Rentals.ca in these markets as demand for small units has increased dramatically and suites are not staying on the market for long.
Annually, the average rent in Toronto has decreased 1.2% from the September 2020 average of $3.31 psf, while the average rent in Vancouver has increased 9.2% from the September 2020 average of $3.27 psf.
In September of 2019, per-square-foot rents in Toronto condo rentals and apartments were 18% higher than Vancouver; in September of 2021, the average rent per square foot for condo rentals and apartments in Toronto was 8% lower than Vancouver.
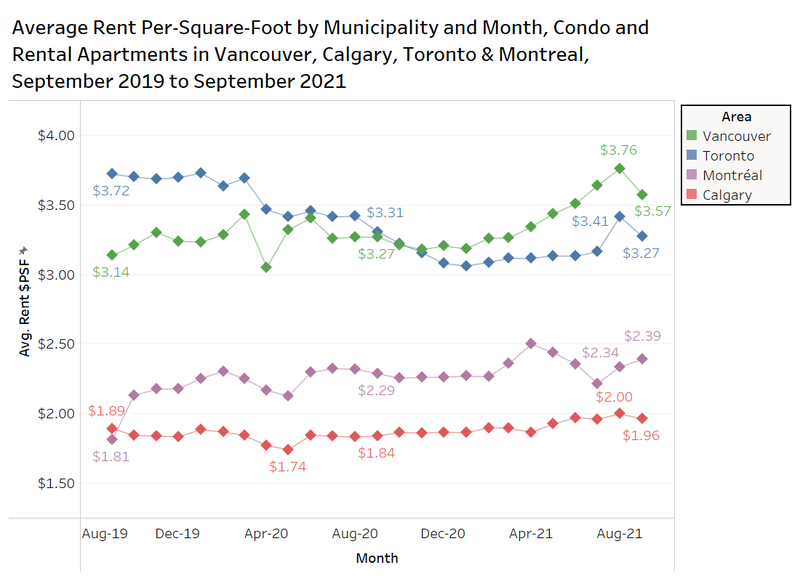 Rents in Montreal and Calgary were not impacted by the pandemic as much as Toronto and Vancouver, with average rents per square foot staying relatively stable between September 2019 and September 2021. The average rent per square foot in Montreal was $2.39 in September 2021, while the average rent per square foot in Calgary was $1.96. On an annual basis, Montreal has experienced an increase of 4.4% from the September 2020 average of $2.29 psf, while Calgary has experienced an increase of 6.5% from the September 2020 average of $1.84 psf.
Municipal Rent Levels by Bedroom Type
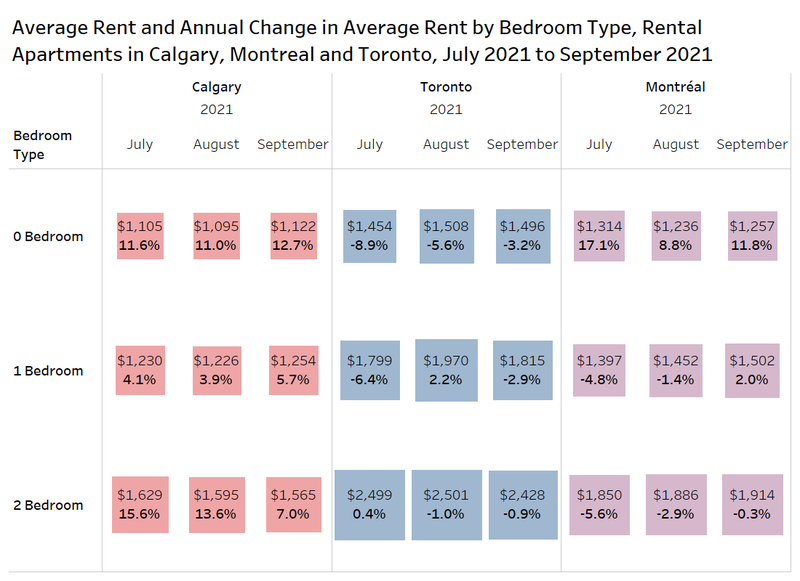
Breaking out the data further by bedroom type and municipality for rental apartments only over the past three months, and concentrating on the markets of Calgary, Toronto and Montreal, the chart below shows the average rent and annual change in average rent for studios, one- bedroom and two-bedroom suites.
Year over year, rent growth in Calgary has been strong for apartments in September 2021, with studio apartments increasing by 12.7%, one-bedroom apartments increasing by 5.7%, and two-bedroom apartments increasing by 7%.
In Toronto, rental rates are slowly recovering, but are still down annually by 3.2% for studio apartments, 2.9% for one-bedroom apartments, and 1% for two-bedroom apartments.
Breaking out the Toronto data by bedroom type and better controlling for changes in the composition of listings shows that rents are down slightly on average from one year ago.
In Montreal, studio apartments have experienced an annual increase of 11.8% in September 2021, while one-bedroom apartments have experienced an increase of 2.0% and two-bedroom apartments have experienced an annual decrease of 0.3%.
 Average Rent since 2019 and Average Rent by Month in Toronto by Property Type
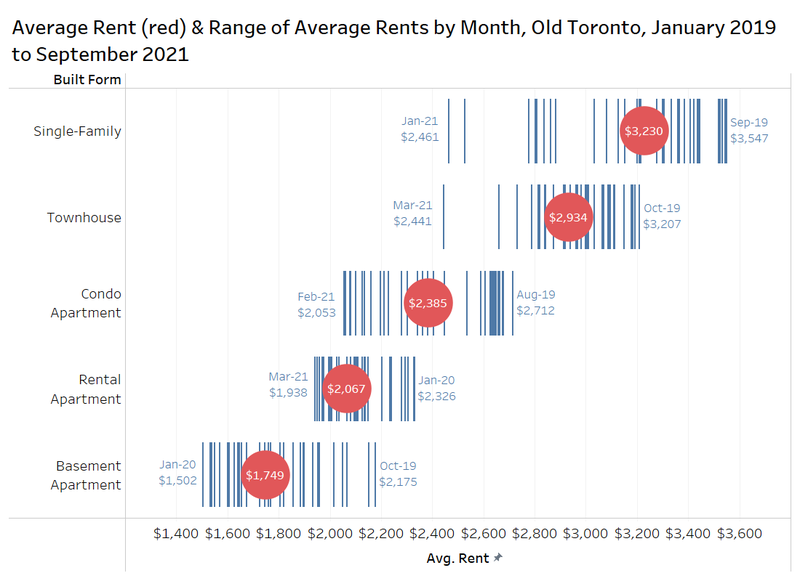
The chart below looks at the average rent by bedroom type in Toronto from January 2019 to September 2021 by property type (red circles), with the blue vertical lines representing the individual monthly averages. The highest and lowest monthly averages are marked over this period.
The market peaks for rental rates in Toronto generally occurred in the fall of 2019 across the board, with monthly lows occurring in early 2021.
For single-family properties, the average rent in Toronto was $3,230 per month, with rents ranging from $2,461 per month to $3,547 per month.
 Average Rent for Select Municipalities in Ontario by Rounded Unit Size
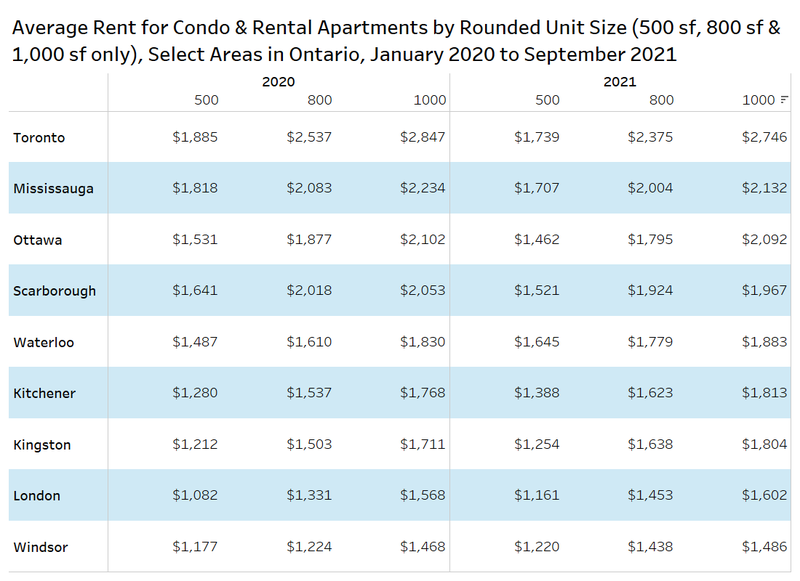
The chart below looks at the average rent for condo rentals and apartments in several municipalities in Ontario in 2020 and year to date in 2021, showing the rental rates for units rounded to 500 square feet (essentially 450 square feet to 549 square feet), rounded to 800 square feet, and rounded to 1,000 square feet.
Many residents of Toronto have considered moving out of the city due to the high rent levels. If a tenant decided to move to Windsor, a unit in the 500-square-foot range would be $500 cheaper than Toronto, while a unit in the 800-square-foot range would be $900 cheaper, and a unit in the 1,000-square-foot range would be $1,300 cheaper.
4. Conclusion
After a tumultuous 2020, the rental market continues to slowly recover on a national basis as the average asking rents across Canada have increased month over month for five months in a row, landing at $1,769 per month in September 2021.
With the demand for larger rental apartment units increasing in 2020, 2021 has seen the demand for smaller rental apartment units start to increase as the demand for larger units remains stable. While condo apartments saw their rental rates decline across the board in 2020 and into 2021, the luxury rental market picked up earlier this year, with tiny units leading the charge in the late summer and early fall.
After working from home became necessary during the pandemic, 2021 has seen a slight return to the office and a decline in demand for home offices and separate spaces for virtual learning. As the population attempts to return to normal from the pandemic, the rental market is returning to normal as well.
Rentals.ca Data
The data used in this analysis is based on monthly listings from Rentals.ca. The data is much different than the more familiar numbers collected and published by Canada Mortgage Housing Corporation (CMHC).
Rentals.ca data includes basement apartments, rental apartments, condominium apartments, townhouses, semi-detached houses and single-detached houses, where CMHC’s primary rental data only includes rental apartments and rental townhouses. CMHC collects some data on the secondary market, but it is reported separately.
The CMHC rental rates are based on the entire universe of purpose-built rental units in Canada (the stock), while Rentals.ca data is primarily based on the asking rents of vacated units only (the flow) — this is a smaller sample size, but more representative of the actual market rent a prospective tenant encounters. The Rentals.ca data set typically produces much higher rental rates in comparison to CMHC, as vacated units are not subject to rent control.
The average and median rental rates via Rentals.ca can also skew higher than CMHC’s data for several reasons: The inclusion of larger and more expensive unit types like singles, row units and condos; the survivorship bias (overpriced units remain in the sample longer); and the multiple listings of the same property at different rent levels every month.
It should also be noted that properties listed for above $5,000 a month and below $500 a month are eliminated from the sample of units analyzed. Also, short-term leases, single-room rentals, and furnished rental units are eliminated from the sample where identifiable.

Rentals.ca is Canada’s premier online marketplace for renters and landlords, providing a comprehensive suite of tools and resources tailored to simplify the rental process. With an extensive selection of listings across the country, Rentals.ca offers user-friendly search functionality that helps renters find their perfect home efficiently. For landlords, Rentals.ca delivers effective advertising solutions to maximize visibility and fill vacancies faster. Committed to innovation and excellence, Rentals.ca aims to empower users with up-to-date market insights and expert guidance, making renting easier and more accessible for everyone.