

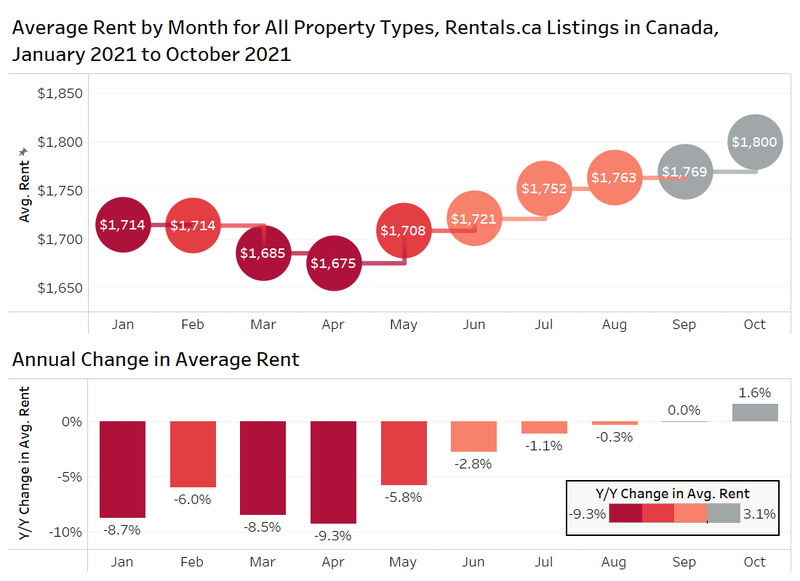
The average rent for all Canadian properties listed on Rentals.ca in October 2021 was $1,800 per month, up 1.6% annually. The average rental rate is up $31 over last month (+1.8% monthly), and $125 from the April low of $1,675 (+7%).
Rentals.ca November 2021 Rent Report
Rentals.ca November 2021 Rent Report
1. National Overview
The chart below shows the average monthly asking rent for all properties listed on Rentals.ca in Canada. The property types include single-family housing, townhouses, rental apartments, condominium apartments, and basement apartments from January 2021 to October 2021 (top panel), with the annual change in rent shown in the bottom panel.
Composition of Listings by Asking Rent
The difficulty in comparing Rentals.ca listings on a monthly and yearly basis is that the composition of the listings is constantly changing. To control for some of those compositional issues, the data will be further broken out by product type, bedroom type, location and rent range to understand where the market is changing.
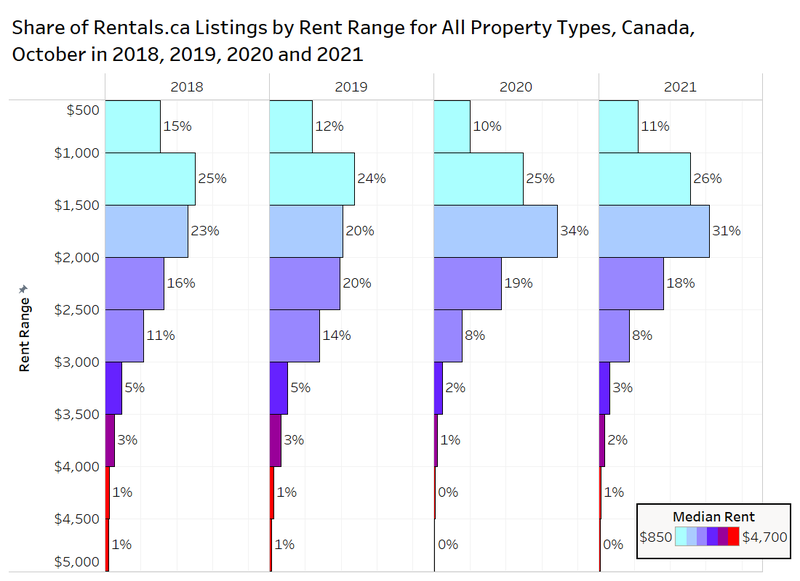
The chart below looks at the distribution of listings on Rentals.ca by $500 asking rent ranges. In October 2020, 34% of the listings were for properties for rent from $1,500 to $2,000 per month. This slightly decreased in October 2021 to 31%. In October 2019, properties in the rent range of $1,500 to $2,000 only made up 20% of the listings.
The most notable change in the share of Rentals.ca listings occurs in the $2,500 to $3,000 rent range, making up 14% of the market in October 2019 down to just 8% in October 2021.
It is important to note that this report analyzes asking rents, which can hide some of the softness (or strength) of the market. When conditions are poor, landlords will often accept rents below their asking rate or offer incentives like one or two months of free rent. The opposite can occur in a strong market, where a tenant offers the landlords more than they ask to outbid the competition.
A unit could also spend several months on the market as a landlord might be reluctant to lower the asking price, especially for a rent-controlled unit where increasing rents in the future is limited if the tenant stays. This can skew the rent level up.
Average Rent by Property Type
The following figure presents the average rent by property types across Canada between October 2019 to October 2021.
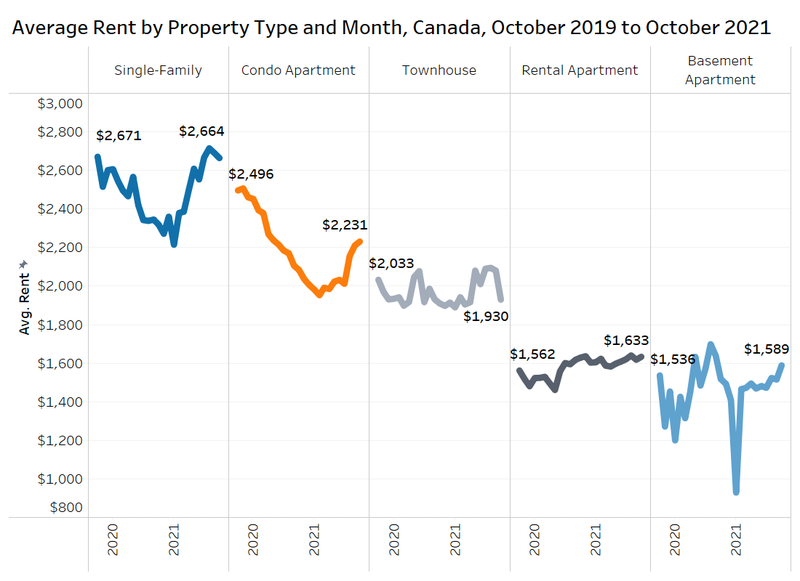
Single-family homes have almost completely recovered to peak 2019 levels, with an October 2021 average of $2,664 per month, however rent is down slightly year over year and month over month. Condo apartments nationally remain well below 2019 highs, with average rent of $2,231 per month in October 2021, up 7% annually and 1% monthly. Condos are still $265 cheaper on a monthly basis in October of this year compared to October 2019 (-11%).
Townhomes, rental apartments, and basement apartments have not been as severely affected by the pandemic compared to single-family homes and condo apartments. But the average rent for these three property types have steadily increased since 2019. In October 2021, townhomes maintained an average rent of $1,930 per month, rental apartments had an average rent of $1,633 per month, while basements had an average rent of $1,589 per month. The average rent for traditional rental apartments is nearly identical to one year earlier, but their average rent nationwide is up nearly 5% over October 2019.
Annual Change in Rental Rates by Property Type
Some of the data in the next chart was mentioned above, but creating a visualization can help show just how wild and inconsistent the last three years have been in the rental market in Canada.
The chart below looks at the annual change in average rent by property type in October 2019, October 2020, and October 2021.
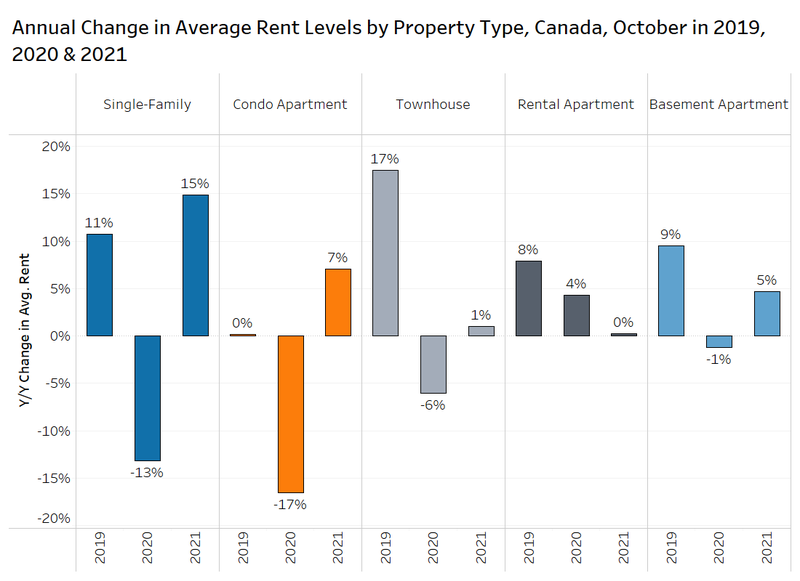
Single-family homes (single-detached and semi-detached) saw average rents rise by 15% annually in October 2021 after experiencing a sharp decline in October 2020 of 13%. Rents had increased by 11% annually in October 2019.
Condominium apartments experienced the biggest annual drop in October 2020, with average rents falling 17% year over year. Fast forward to October 2021, and condominium apartments have yet to fully recover those losses. Despite considerable rent growth for all other property types in 2019, condo rent growth was non-existent in October 2019. However, shrinking unit sizes as the result of investors focusing on tiny suites when buying pre-construction clearly had an impact.
Townhouse rents have not increased as much as single-family homes or condos in October 2021, increasing by just 1% annually. Townhouse rents also did not experience as big of a downturn compared to singles and condos in October 2020, decreasing by a comparatively small 6%.
The rental apartment market segment did not experience the same levels of decline as the other property types, instead increasing by 4% annually during the pandemic-impacted 2020, and maintaining the same rent level into October 2021. However, it should be noted that several landlords offered (and are still offering in some cases) incentives like a free month of rent to entice tenants to their buildings.
Average Rent Per-Square-Foot by Property Type
As mentioned above, the changing composition of listings can have a big impact on movements in rent on a monthly basis. The location, interior finish, unit positions within a building (corner or interior suite), the floor the unit is on, are big factors, but one of the biggest is the unit’s size or the market’s average suite size. The square footage of a rental property is available for many, but not all, of the properties listed on Rentals.ca, so the sample size of the chart below is smaller, but unit sizes are controlled.
The following figure presents the average rent per square foot by property type across Canada between October 2019 to October 2021.
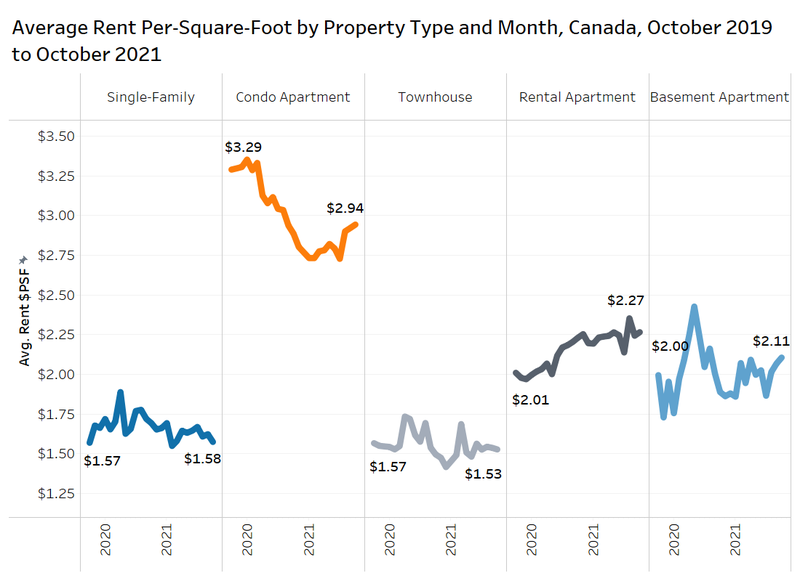
Condo apartments experienced the largest decline in average rent per square foot throughout 2019 and 2020, before finally bouncing back in 2021. Rent declined 12% year over year in October 2020, with an increase of just under 2% since.
The average rent per square foot for rental apartments has been largely unaffected by the pandemic, steadily increasing since 2019 to $2.27 per square foot (psf) in October 2021, from $2.23 psf in October 2020 and $2.01 psf during the same month in 2019.
Basements, with a smaller sample size, have experienced significant rent volatility. Overall, the rent per square foot for basement apartments was $2.11 psf in October 2021.
The average rents per square foot for single-family homes and townhouses, while experiencing some slight ups and downs, have remained fairly steady since 2019. The average rent per square foot for single-family homes was $1.58 in October 2021, and was $1.53 for townhouses.
Average Rental Rates by Bedroom Type
The chart below looks at the average rent for all property types by bedroom type for studio to five-bedroom units in Canada in October 2021 (shown in orange), the previous three Octobers are also shown. The colour and the shape of the markers reflect the year.
The data shows that, on average, a tenant will have to pay about $260 more in rent to go from a studio unit to a one-bedroom unit. For a tenant looking to upgrade from a one-bedroom to a two-bedroom unit, they’ll be looking at spending about $320 more on average in Canada.
After that, a third bedroom will cost a tenant $380 more. A fourth bedroom will cost $640 more, likely because the majority of three-bedroom units are only available via single-family and townhouse properties. In addition to an extra bedroom, they’re likely gaining some outdoor property and additional parking (also more convenient parking closer to their unit). Adding a fifth bedroom will cost a tenant another $390 per month.
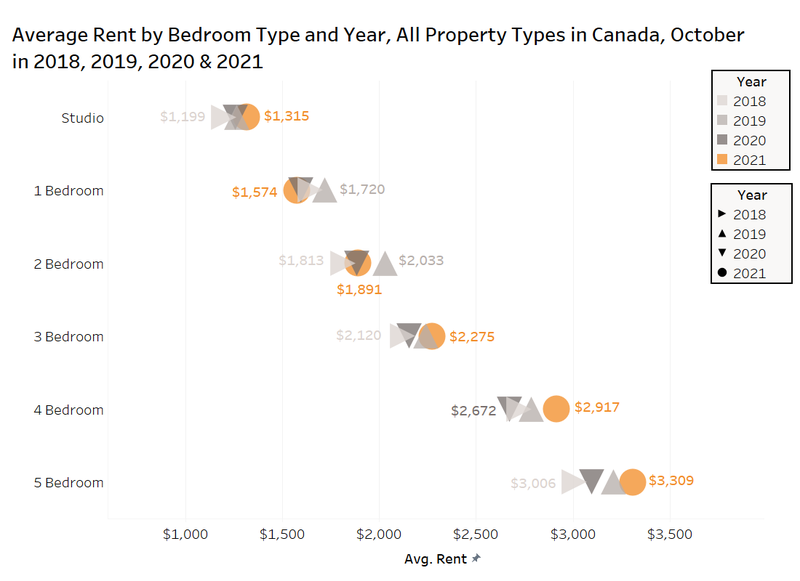
Compared to the last three Octobers, studios, three-bedroom, four-bedroom and five-bedroom suites are all highest in 2021. One-bedroom suites are at their lowest point over the four-year period, while two-bedroom units at $1,891 per month, are higher than 2018’s $1,813 per month average, but below 2019’s $2,033 per month average.
2. Provincial Rental Rates
The figure below presents the average rent for all property types in select provinces across Canada between October 2019 and October 2021.
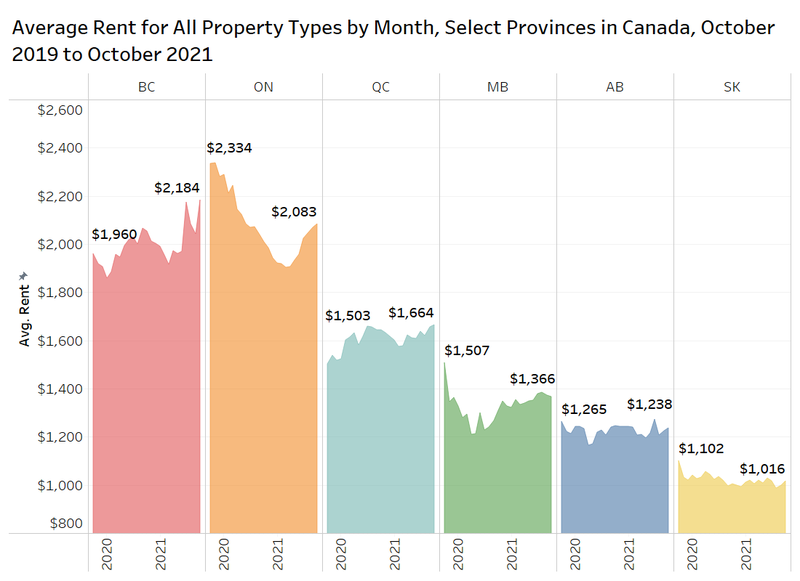
The average rent in British Columbia was $2,184 per month in October 2021, the highest in the country. Average rents are up 6% annually and 11% from October 2019.
Ontario rents fell from $2,334 in October 2019 to $1,905 in March 2021 (-18%). Rent has increased by 9% since March, but remains down by 11% from two years ago.
Quebec, Manitoba and Saskatchewan have all experienced annual rent growth of about 1%, while Alberta rents are down by $6 from a year earlier (-0.5%).
Change in Average Rents by Rounded Unit Size and Month (Ontario and Alberta)
As mentioned earlier, the change in the composition of the sample of listings analyzed can have an influence on the average, and result in a conclusion that the market is correcting or improving when it hasn’t. The best comparables are as “apples-to-apples” as possible, while still maintaining a robust sample of listings.
The following chart tries to control for the product type, location and unit size by looking at the average rent, and annual change in average rent in Ontario and Alberta, for rental apartments from 450 square feet to 1,149 square feet (rounded to the nearest hundredth) for the April to October period in 2021 and 2020. Each bar is marked with the average rent and annual change in average rent.
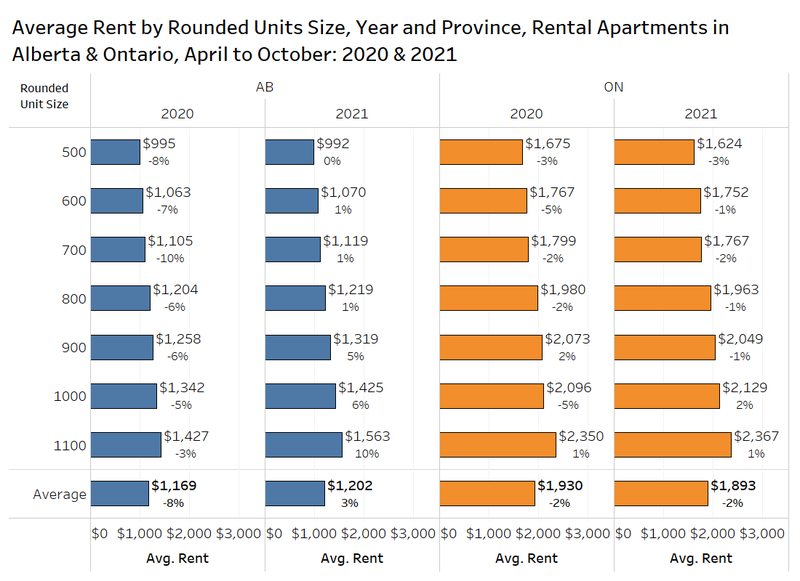
In Alberta, all of the rounded unit size segments experienced a decline in average rent in the April-October 2020 period in comparison to the same duration a year earlier, ranging from a decline of 3% in units with a rounded size of 1,100 square feet to 10% in units with a rounded size of 700 square feet (the first seven months of the COVID-19 pandemic).
In the April to October 2021 period, almost all of the units experienced an increase in average rents in Alberta. The largest increase was experienced by units in the 1,100-square-foot range at 10%, emphasizing the continuing demand for larger units during the extended pandemic period.
In Ontario, the April to October 2020 period told a similar story, with nearly all rounded unit size segments experiencing a slight decline in average rent ranging between 1% and 5% during the early portion of the pandemic last year. The only market segments that did not see a decline in average rent were 900-square-foot units (increased 2% annually) and 1,100-square-foot units (increased 1% annually).
Unlike Alberta, the last seven months of data show that the downward trend continued in Ontario, with the majority of rounded unit size segments experiencing a decline in average rent between 1% and 3% (likely due to the opening of the economy happening later in Ontario). Units with a rounded unit size of 1,000 square feet and 1,100 square feet experienced an annual increase of 2% and 1% respectively in April-October 2021.
3. Municipal Rental Rates
Change in Average Rent for Select Municipalities and Former Municipalities
The chart below presents data on the average rent for all property types in select municipalities in Canada (Toronto is broken up into its former municipalities, prior to amalgamation). Data covers October 2020 and October 2021.
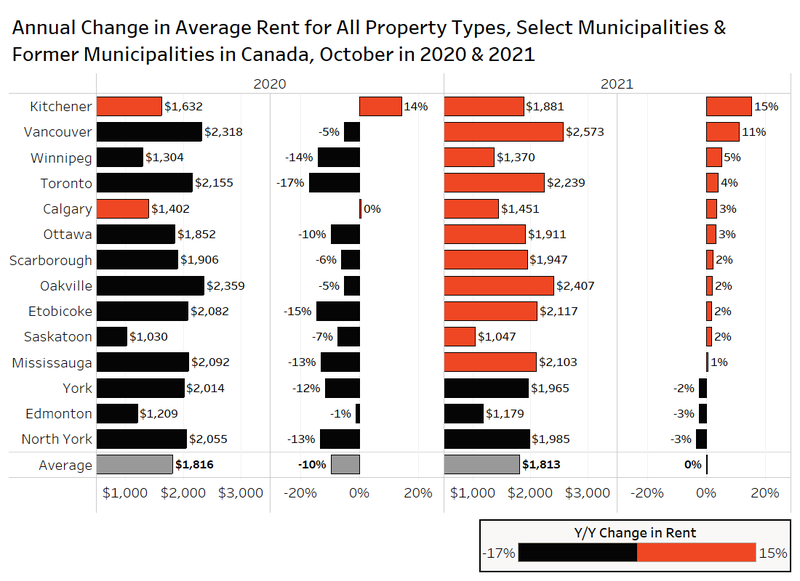
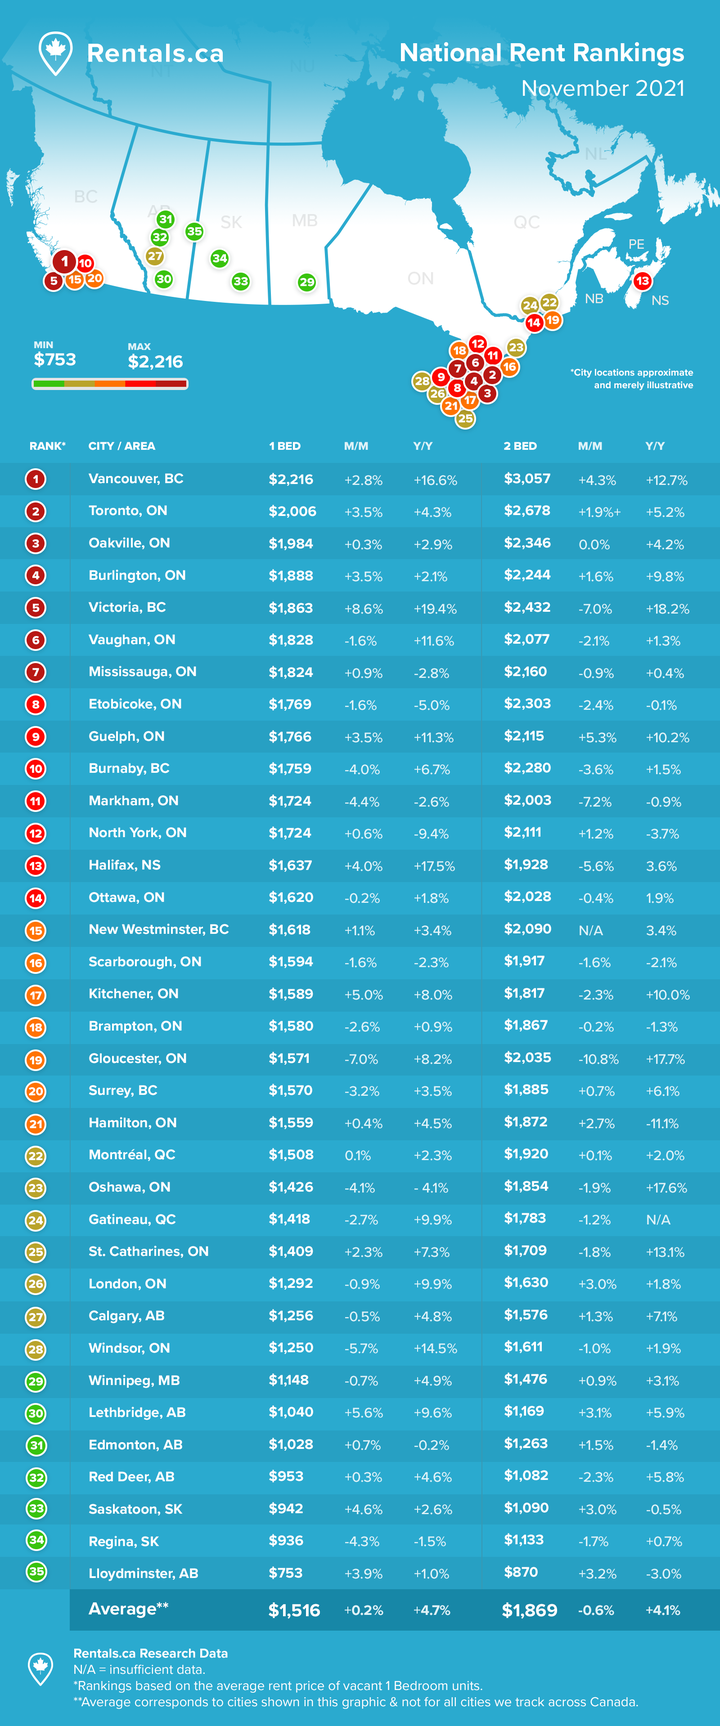
Kitchener has experienced the largest annual increase in average rent at 15% in October 2021, followed by Vancouver at 11%. The average rent in Kitchener also experienced a significant increase in October 2020 of 14% annually. Kitchener has become extremely popular in recent years, likely amplified by the pandemic-induced exodus from downtown Toronto.
The majority of the municipalities did not experience significant change year over year in October, with eight of the 14 cities on this list experiencing a year-over-year change between 1% and 4%.
Average Rent by Bedroom Type for Condo & Rental Apartments by Area
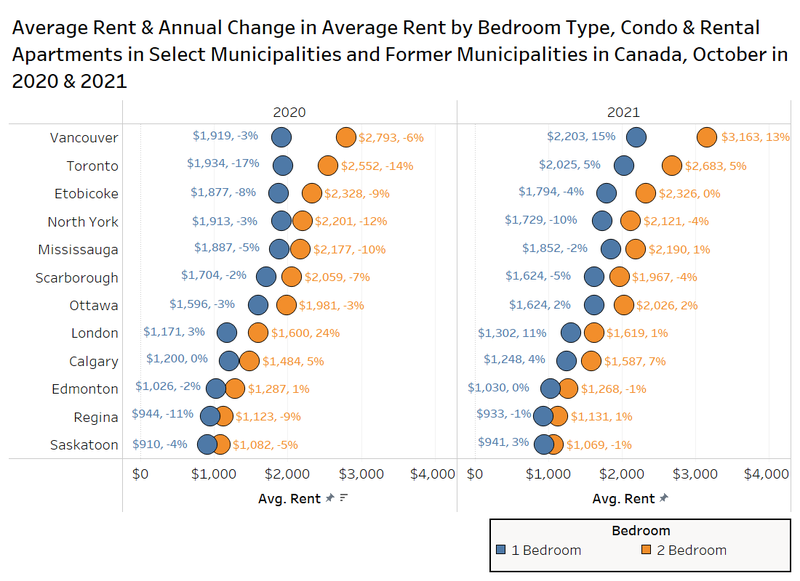
The figure below presents data on the average rent and annual change in average rent for one-bedroom and two-bedroom condo and rental apartments in select municipalities in October 2020 and October 2021.
In October 2020, one-bedroom apartments in many of the select municipalities experienced an annual decline in average rent, ranging from a decline of 2% in Scarborough and Edmonton to a significant decline of 17% in Toronto. Two-bedroom units also experienced significant declines, ranging from a drop of 3% in Ottawa to 14% in Toronto. Notably, the average rent for one-bedroom and two-bedroom units in London actually increased by 3% and 24% respectively in October 2020 (part of this rise can be attributed to a new luxury apartment rentals starting its leasing program.
October 2021 has seen the average rent for one-bedroom units and two-bedroom units begin to slowly increase. For example, one-bedroom units in Toronto have increased by 5% annually, while one-bedroom units in Vancouver have increased by 15%. The average rent for a one-bedroom unit in London continues to increase annually at 11%. The average rent for two-bedroom units has experienced an annual change ranging from -4% in North York and Scarborough up to 13% in Vancouver.
4. Conclusion
Rental rates across Canada are on the path to recovery after a tumultuous 2020, posting steady increases over the past several months — good news for landlords and bad news for tenants who are already experiencing inflation elsewhere.
The single-family rental market has led the recovery, almost returning to the peak levels of 2019, as many families are choosing to rent instead of paying the high resale housing prices that have spiked across the country. It is expected that there will be a number of interest rate hikes in 2022, that could further dissuade potential renters from becoming owners.
Condos have also started on the road to recovery after experiencing sharp declines in 2020, which is good news for condo investors, who have continued to purchase pre-construction units in record numbers in many major Canadian cities.
Rent increases for single-family homes combined with the average rent for larger units (1,000 square feet and 1,100 square feet) in provinces such as Alberta and Ontario lend support to the idea that demand for larger units continues to be high as the working population sticks with the work-from-home trend.
Kitchener becoming such a desirable municipality (with rents increasing 14% in 2020 and 15% in 2021) could be a sign of things to come as tenants continue to look for more affordable options for larger units. Other cities and areas outside of downtown city centres could begin or continue to heat up in a similar fashion.
Rentals.ca Data
The data used in this analysis is based on monthly listings from Rentals.ca. The data is much different than the more familiar numbers collected and published by Canada Mortgage Housing Corporation (CMHC).
Rentals.ca data includes basement apartments, rental apartments, condominium apartments, townhouses, semi-detached houses and single-detached houses, where CMHC’s primary rental data only includes rental apartments and rental townhouses. CMHC collects some data on the secondary market, but it is reported separately.
The CMHC rental rates are based on the entire universe of purpose-built rental units in Canada (the stock), while Rentals.ca data is primarily based on the asking rents of vacated units only (the flow) — this is a smaller sample size, but more representative of the actual market rent a prospective tenant encounters. The Rentals.ca data set typically produces much higher rental rates in comparison to CMHC, as vacated units are not subject to rent control.
The average and median rental rates via Rentals.ca can also skew higher than CMHC’s data for several reasons: The inclusion of larger and more expensive unit types like singles, row units and condos; the survivorship bias (overpriced units remain in the sample longer); and the multiple listings of the same property at different rent levels every month.
It should also be noted that properties listed for above $5,000 a month and below $500 a month are eliminated from the sample of units analyzed. Also, short-term leases, single-room rentals, and furnished rental units are eliminated from the sample where identifiable.

Rentals.ca is Canada’s premier online marketplace for renters and landlords, providing a comprehensive suite of tools and resources tailored to simplify the rental process. With an extensive selection of listings across the country, Rentals.ca offers user-friendly search functionality that helps renters find their perfect home efficiently. For landlords, Rentals.ca delivers effective advertising solutions to maximize visibility and fill vacancies faster. Committed to innovation and excellence, Rentals.ca aims to empower users with up-to-date market insights and expert guidance, making renting easier and more accessible for everyone.