

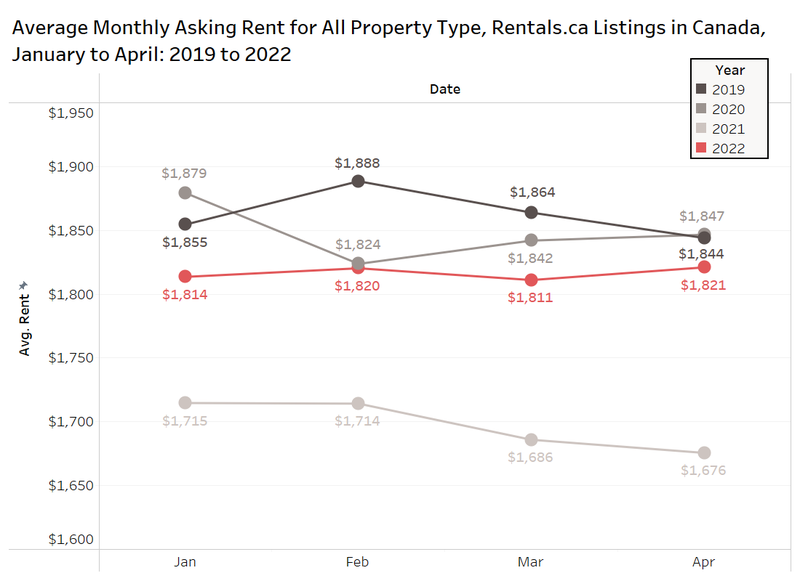
The average rent for all Canadian properties listed for rent on Rentals.ca in April 2021 was $1,675 per month, an annual decline of 9% and a monthly decline of 1%. The median rental rate was $1,600 per month in April, a 13% decrease from a year earlier, and a monthly decline of 2%.
National Overview
Rental rates continue to fall on a national basis, but a more in-depth analysis of the changes regionally and by product type is required to better understand the current market conditions.
 Average Rent by Property Type and Month
The chart below shows the average rent levels in Canada by property type for March and April in 2020 and 2021, the monthly percentage change in rent is shown for April in both years.
The most expensive units are single-family homes, with landlords asking $2,502 per month on average in April 2021, compared to $1,992 for condominium apartments, $1,913 for townhouses, $1,583 for rental apartments, and $1,496 for basement apartments.
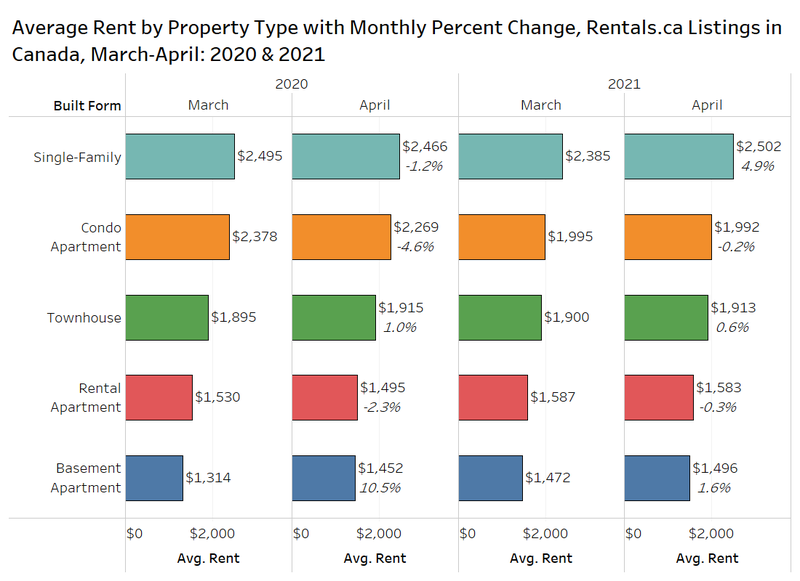 Single-family properties increased month over month, rising 4.9% from $2,385 to $2,502. Single-family homes also experienced an annual increase in average rent between April 2020 and April 2021, rising 1.5% from $2,466 up to $2,502.
Condo apartments experienced an annual decrease in average rent, declining 12.2% year over year between April 2020 and April 2021 from $2,269 down to $1,992 per month, while showing a monthly decline of 0.2%.
Townhome rents were virtually unchanged on an annual basis, moving from $1,915 per month in April 2020 to $1,913 per month in April 2021. Average rents for townhouses increased 0.6% monthly.
Rental apartments, which make up the majority of the listings on Rentals.ca, experienced a year-over-year increase of 5.9%, moving from $1,495 in April 2020 up to $1,583 in April 2021. Rental apartments also experienced a month-over-month decline of 0.3% between March and April 2021. Given the large size of rental apartment listings, they are the most reliable property type to review and are the most reflective of rental market conditions nationally.
Rent by Bedroom Type
The line chart below presents data on the average rent by bedroom for all property types in Canada from January 2020 to April 2021. Average monthly asking rents are shown for April 2020 and April 2021.
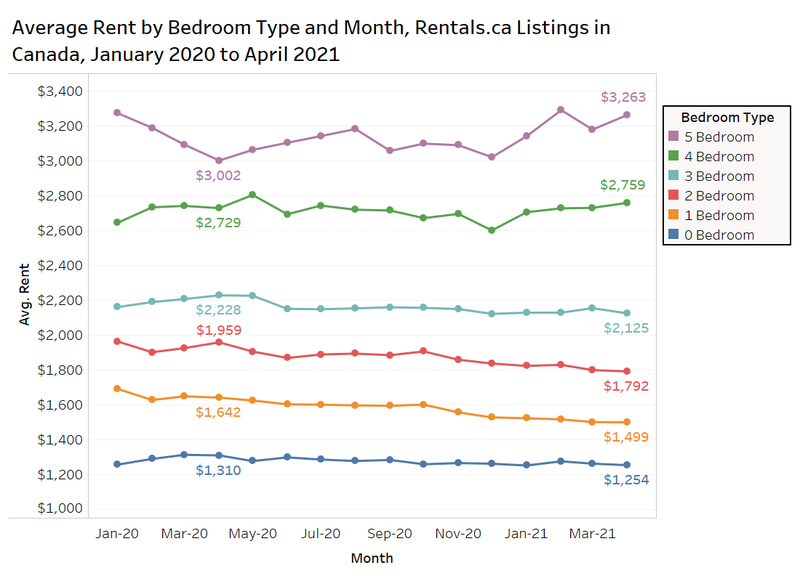 The average rent for one-bedroom units in April 2021 was $1,499 per month, which is an annual decrease of 9%. Rents were $3 cheaper month over month.
Two-bedroom units experienced an annual decrease in average rent of 9%, moving from $1,959 per month dwn to $1,792 per month. The average rent is $8 cheaper month over month.
The largest increase occurred for five-bedroom properties, moving from $3,002 per month in April 2020 up to $3,263 per month in April 2021, an annual gain of 9%.
Larger single-family homes have performed well during the pandemic as tenants seek out more space to work from home and for virtual learning for their children.
Rent Per Square Foot
The chart below shows the average and median rent per square foot (psf) for rental and condominium apartments in Canada by month since the start of 2019 based on Rentals.ca listings where the landlord or owner provided the suite’s size.
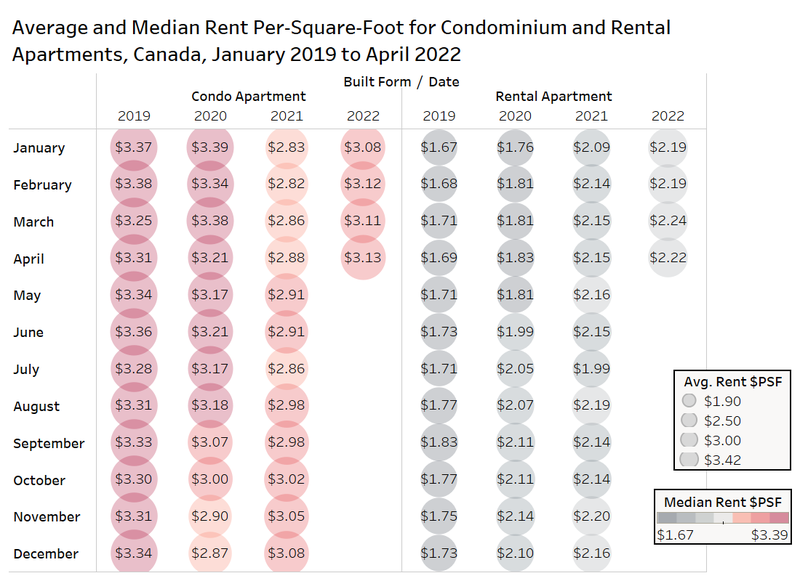 The average and median rent per square foot has stayed the same month over month at $2.34 psf and $2.29 psf, respectively.
For most of 2020, the average rent per square foot hovered around $2.40, with a higher average rent per square foot of $2.49 in January 2020 and April 2020. The median rent per square foot on the other hand, fluctuated throughout 2020, reaching a low of $2.18 psf in February 2020 and a high of $2.37 psf in October 2020.
A lot of the decline can be attributed to the downtown Toronto condo market.
Provincial Rental Rates
In the chart below, median rents are shown by province for all property types in April 2021 on the coloured map. The average rent and change in average rent on a monthly basis is also shown.
On a provincial level, British Columbia had the highest rental rates in April 2021, with landlords seeking $1,973 per month on average for all property types (bottom panel below), with a median rent of $1,850 (bottom panel). British Columbia rents increased by 3% monthly.
Ontario had the second highest rental rate at $1,906 per month (median: $1,800), while Newfoundland and Labrador had the lowest at $933 per month (median $900).
These graphics show how important it is to break down the national data into smaller geographic areas, as all of the major provinces experienced monthly increases, even though the national average declined monthly. The likely reason is the share of listings in Ontario declined month over month, so fewer listings for more expensive properties contributed to the drop in average rents in Canada.
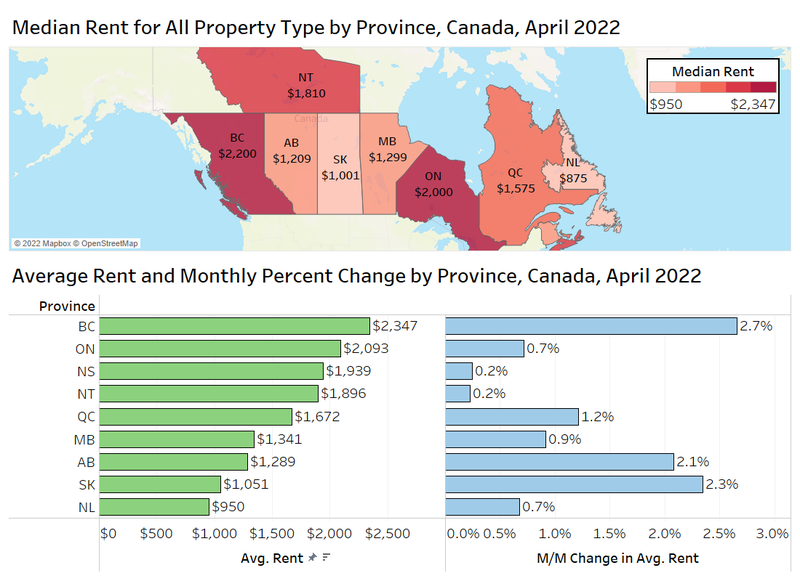 Nova Scotia, although a small market, had the largest increase in the country, rising 3.8% monthly in April 2021, with average rent rising to $1,657.
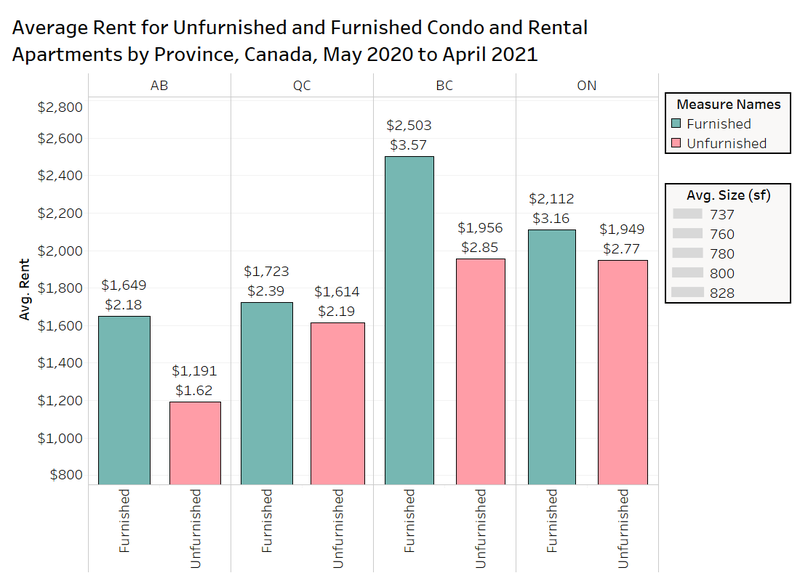
Furnished Rental Rates
There has been much talk about COVID-19’s impact on the short-term rental market with travel restrictions in place. Anecdotal evidence suggests there has been an increase of furnished apartments for rent according to many property listing agents.
There are four provinces with a noteworthy number of furnished rental and condominium apartments in Canada: Alberta, Quebec, British Columbia and Ontario.
In British Columbia, the average furnished apartment is listed for 28% more than unfurnished apartments ($2,503 vs $1,956 per month), while the rent per square foot is 25% more.
In Ontario, the difference in average rent and average rent per square foot was much smaller than that of British Columbia. Furnished units in Ontario had an 8% higher average rent, and a 14% higher average rent per square foot.
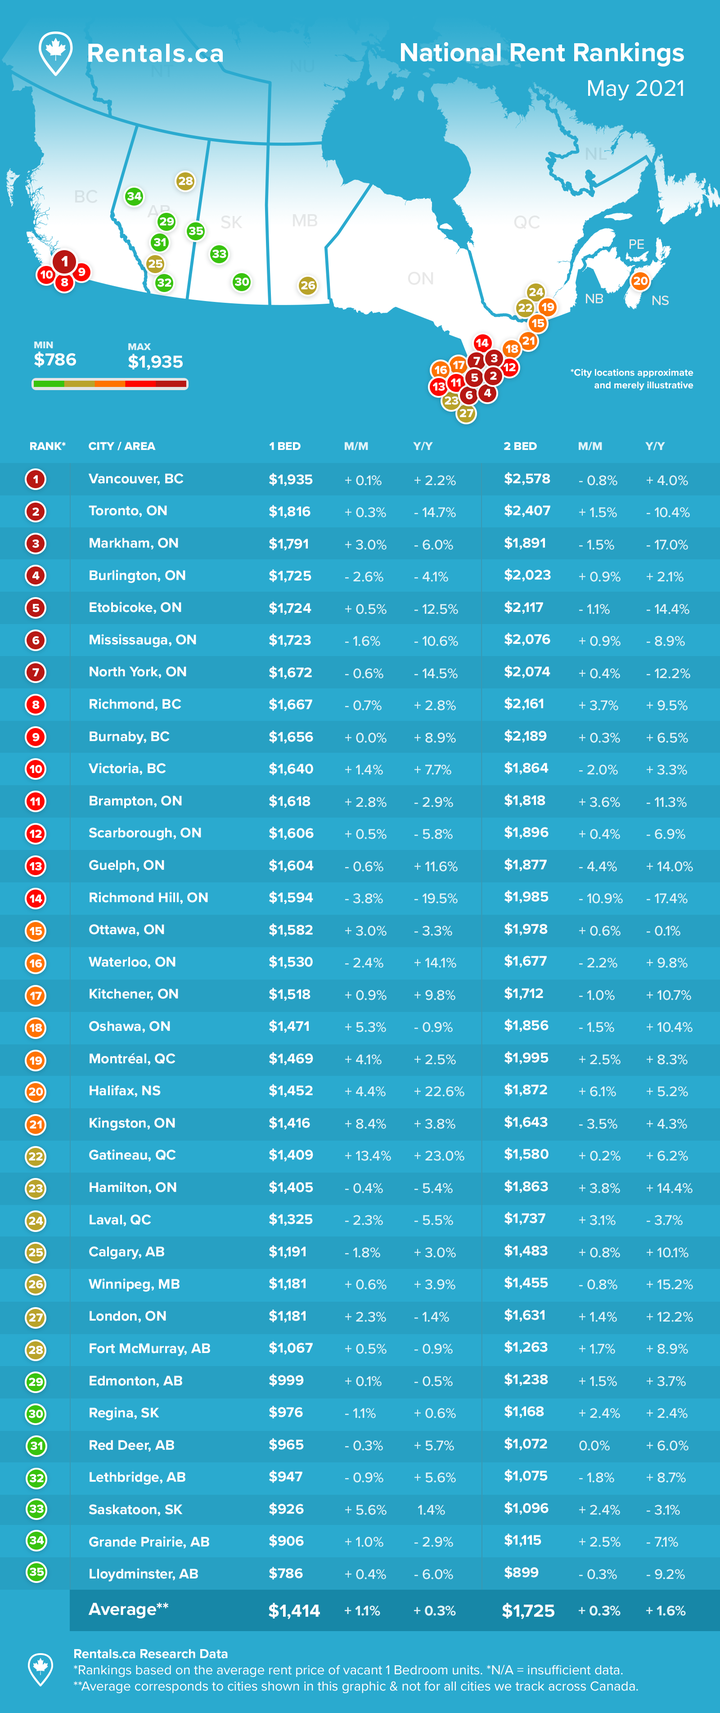
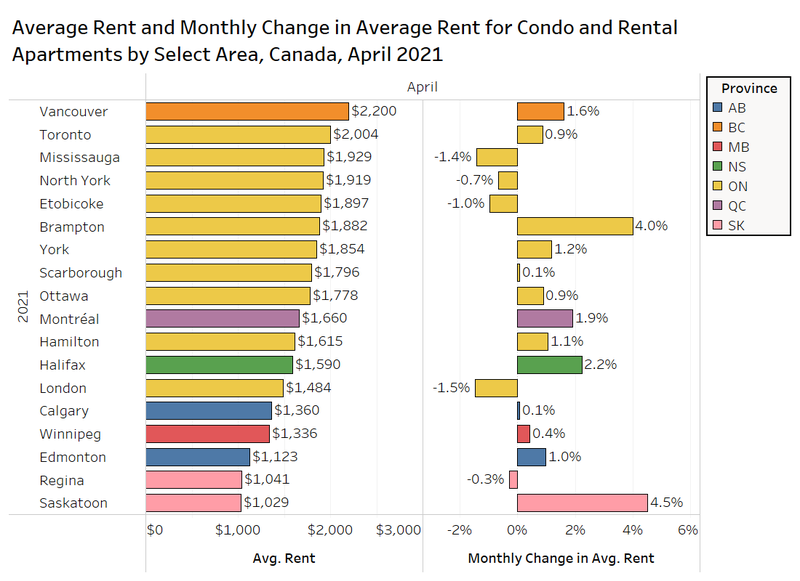
Municipal Rental Rates
The chart below presents data on the average rental apartment and condominium apartment rental rate by municipality (area) in Canada for April 2021, with the monthly percent change in average rent shown on the right.
Vancouver had the highest average asking rents in Canada in April for apartments (both tenures) at $2,200 per month, followed by Toronto at $2,004 per month (former City of Toronto boundaries prior to amalgamation), then by Mississauga at $1,929 per month.
Several areas experienced month-over-month increases, including a 4.5% increase in Saskatoon, a 4% increase in Brampton, and a 2.2% increase in Halifax. Most of the major markets saw monthly increases, including Vancouver, Toronto, Ottawa, Montreal, Calgary, Winnipeg and Edmonton.
A handful of areas have experienced month-over-month decreases in average rent. These areas include: London with a monthly decline of 1.5%, as well as Mississauga, Etobicoke and North York with a monthly decline of approximately 1%.
 The table below shows the average rent, average rent per square foot and annual change in these rent levels for select municipalities and former municipalities in Canada for condominium and rental apartments.
The largest annual decreases in average rent were experienced by Etobicoke at 15%, Toronto at 13%, North York at 11%, and Mississauga at 10%. On the other end of the spectrum, London saw its average rent increase annually by 14%, while Calgary and Winnipeg saw their average rent increase annually by 11%.
It should be noted that in the first full month of the pandemic in April 2020, several landlords discounted their rents, so the annual increases in a couple of areas are higher than expected.
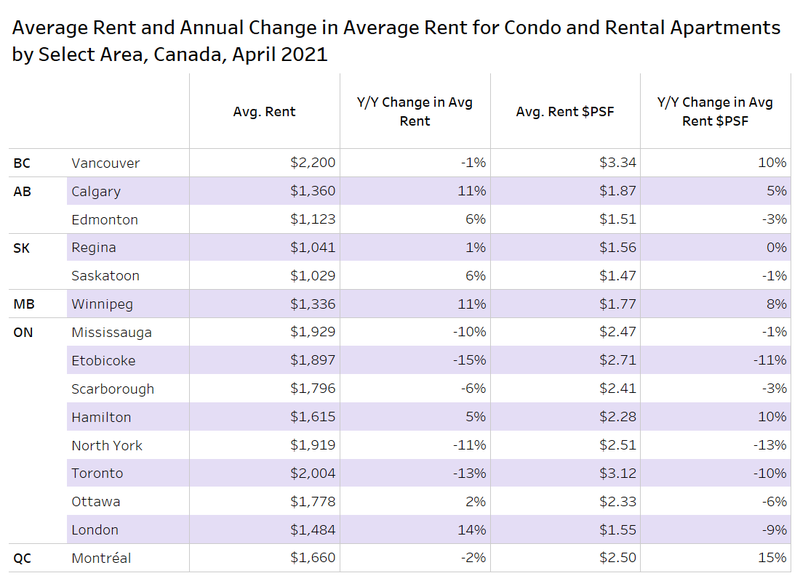 Rent per square foot in Toronto is down 10% annually to $3.12, while Vancouver is up 10%. However, as mentioned in previous National Rent Reports, these are asking rents, and there has been an increase in listings on the market for small suites, which typically have higher per-square-foot rents, which likely contributed to the 10% rise in Vancouver.
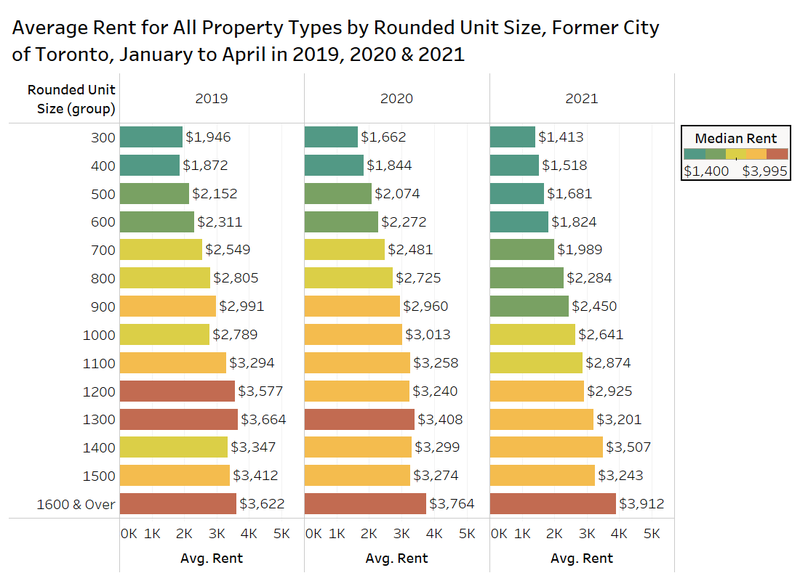
Rounded Unit Size in Toronto
The average rent by rounded unit size for the first four months of the year in 2019, 2020 and 2021 is shown in the chart below. This graphic includes all property types.
The 600-square-foot and 700-square-foot units are down 20% annually when you compare the January to April 2021 period to the same four months last year.
Units rounded to 1,600 square feet or larger have seen rents increase by 4% annually in 2020 and 2021.
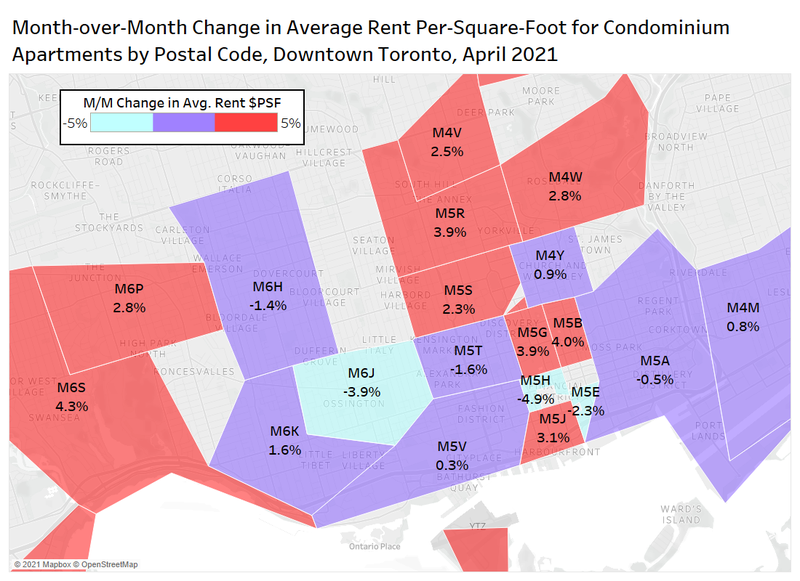
 Average Condominium Apartment Rent Per Square Foot by Postal Code
The condo rental market really dropped during the pandemic, but the data shows the market could have turned the corner.
The chart below presents data on the monthly change in the average rent per square foot for condominium apartments for lease in downtown Toronto.
The areas experiencing the biggest increases in April 2021 over March 2021 were M6S, M5B, M5R, and M5G, at 4.3%, 4.0%, 3.9%, and 3.9%. The largest declines were experienced by M5H and M6J at 4.9% and 3.9%, respectively.
The area with the most condo rental activity is postal code M5V, which has experienced a 0.3% monthly increase in rent growth in April 2021 on a per-square-foot basis.
Conclusion
The average rent in Canada declined month over month, but because of the shifting composition of national listings, this doesn’t tell the full story. Average rental rates increased month over month in British Columbia, Ontario, Alberta and Quebec, suggesting the market might have turned a corner with increased tenant demand.
House prices have risen across the country despite the pandemic, and some prospective buyers have given up their search due to the frothy market conditions.
The third wave of COVID-19 continues to wreak havoc in certain areas of the country, but that has not stopped tenants from trying to get into the rental market before rents move back to pre-COVID levels.
Rental rates might be increasing in several provinces and municipalities, but rental incentives are still prevalent at the top of the market, as the luxury apartment market has yet to recover.
We will continue to monitor the data and market trends. Please reach out to us with your commentary, questions or data requests.
Rentals.ca Data
The data used in this analysis is based on monthly listings from Rentals.ca. The data is much different than the more familiar numbers collected and published by Canada Mortgage Housing Corporation (CMHC).
Rentals.ca data includes basement apartments, rental apartments, condominium apartments, townhouses, semi-detached houses and single-detached houses, where CMHC’s primary rental data only includes rental apartments and rental townhouses. CMHC collects some data on the secondary market, but it is reported separately.
The CMHC rental rates are based on the entire universe of purpose-built rental units in Canada (the stock), while Rentals.ca data is primarily based on the asking rents of vacated units only (the flow) — this is a smaller sample size, but more representative of the actual market rent a prospective tenant encounters. The Rentals.ca data set typically produces much higher rental rates in comparison to CMHC, as vacated units are not subject to rent control.
The average and median rental rates via Rentals.ca can also skew higher than CMHC’s data for several reasons: The inclusion of larger and more expensive unit types like singles, row units and condos; the survivorship bias (overpriced units remain in the sample longer); and the multiple listings of the same property at different rent levels every month.
It should also be noted that properties listed for above $5,000 a month and below $500 a month are eliminated from the sample of units analyzed. Also, short-term leases, single-room rentals, and furnished rental units are eliminated from the sample where identifiable.

Rentals.ca is Canada’s premier online marketplace for renters and landlords, providing a comprehensive suite of tools and resources tailored to simplify the rental process. With an extensive selection of listings across the country, Rentals.ca offers user-friendly search functionality that helps renters find their perfect home efficiently. For landlords, Rentals.ca delivers effective advertising solutions to maximize visibility and fill vacancies faster. Committed to innovation and excellence, Rentals.ca aims to empower users with up-to-date market insights and expert guidance, making renting easier and more accessible for everyone.