

Rentals.ca March 2021 Rent Report
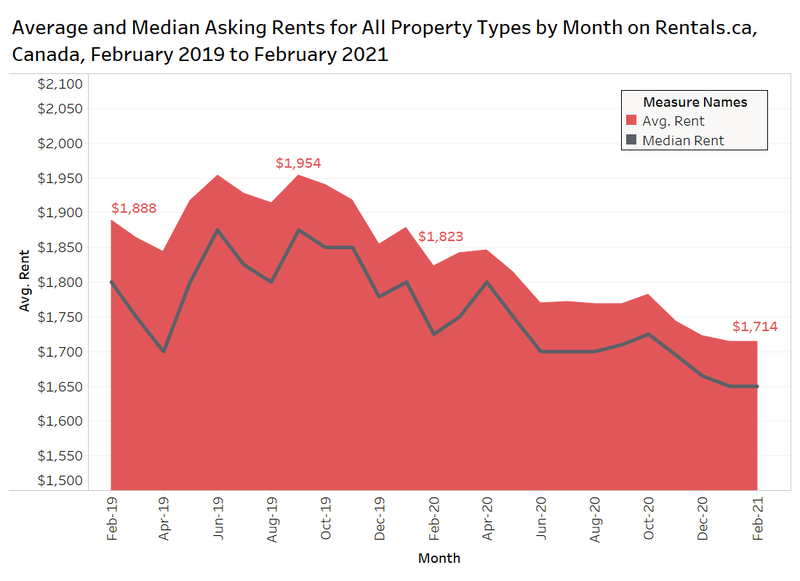
The average monthly asking rent for Canadian properties on Rentals.ca in February 2021 was $1,714 per month, a decline of 6% annually from $1,823 in February of last year. Since hitting a high of $1,954 in August of 2019, the average monthly rental rate has steadily declined, now down $240 from the peak. Month over month, the average rent was virtually unchanged
Rentals.ca March 2021 Rent Report
Rentals.ca March 2021 Rent Report
1. National Overview
The median rent was also unchanged month over month at $1,650, but is down 4% annually.
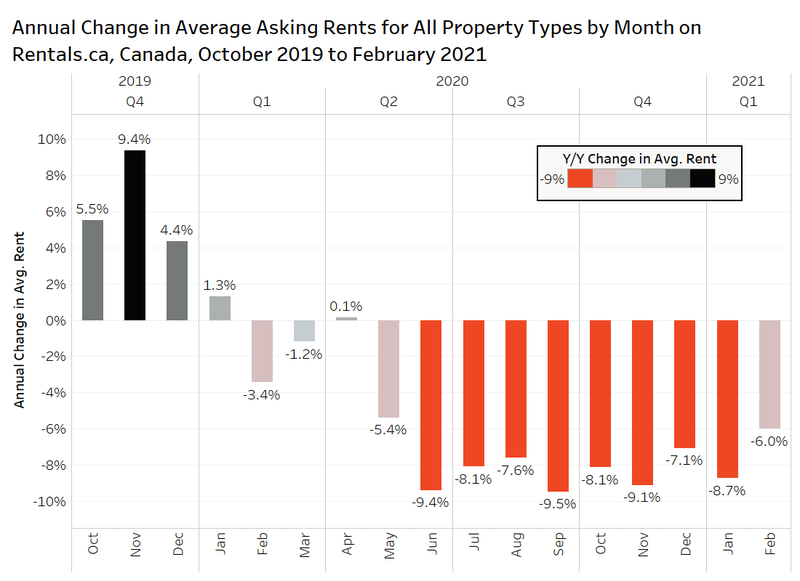
 The average monthly rental rate has been down year over year in 12 of the last 13 months, with the rates showing a decrease between 7% and 9.5% between June 2020 and January 2021. The February 2021 decline of 6% is the lowest annual decrease experienced in the past nine months.
This is in stark contrast to the 9.4% annual increase in November of 2019.
 Average Rent by Built Form and Month
The following chart shows the average monthly rent and annual change in average rental rate in January and February of 2020 and 2021, organized by property type. The chart includes single-family (single-detached and semi-detached), townhouses (both freehold and condominium tenure), condominium apartments, and rental apartments.
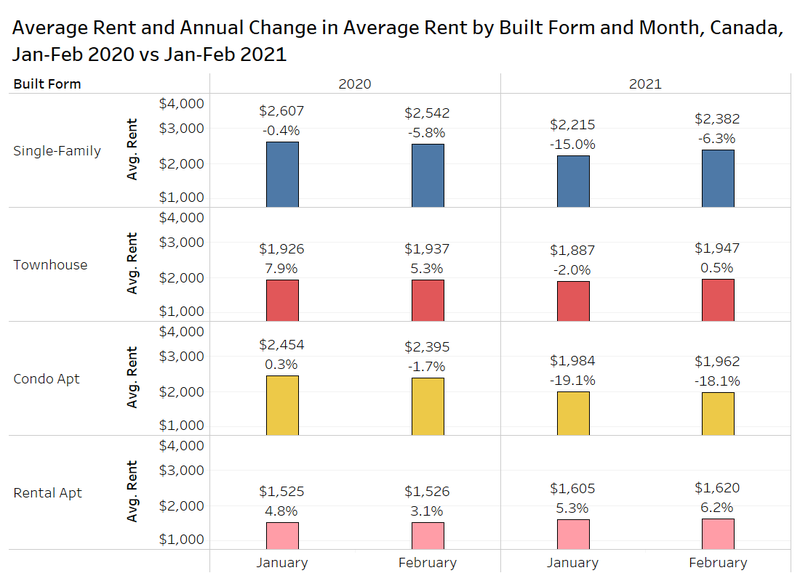 Single-family homes maintained the highest average monthly rent among these property types at $2,382 per month, experiencing an annual decline of 6.3% from the previous year’s average of $2,542 per month. The average monthly rent for single-family homes increased month over month however, up 7.5%. There is more volatility in rents for single-family properties because the sample size is smaller, but also because the range of single-family homes can be so wide.
There are two-bedroom single-family homes at 1,000 square feet on lots with 20 feet of frontage, while there are also six-bedroom properties with 5,000 square feet on two-acre lots listed on Rentals.ca.
The average monthly rent for townhouses was $1,947 per month in February 2021, an annual increase of 0.5%. Townhomes experienced a 3.2% increase from the January 2021 average rental rate of $1,887 per month.
Condo apartments have experienced significant declines in 2021, posting annual decreases of 18.1% in February and 19.1% in January — this is primarily due to the weakness in Toronto’s downtown core. The average monthly rental rate for a condo apartment in February 2021 was $1,962 per month, compared to $2,454 in January 2020.
The average monthly rental rate for purpose-built rental apartments have steadily increased, showing a 5.3% annual increase in January 2021, and a 6.2% annual increase in February 2021. The average monthly rental rate for rental apartments in February 2021 was $1,620 per month.
Percent Distribution of Rentals.ca Listings by Rent Range
This figure below shows the distribution of listings by rental rate for all property types in Canada via Rentals.ca listings. 2019 and 2020 show relatively similar distributions.
The distribution of listings by price in 2021 is clearly different as there is a larger percentage of units listed around the $1,600 per month range, double the rate of the last two years. In 2021, there has been a big drop in the number of listings from $2,200 to $2,400 per month, which we again attribute to a drop in condo rental rates in Toronto.
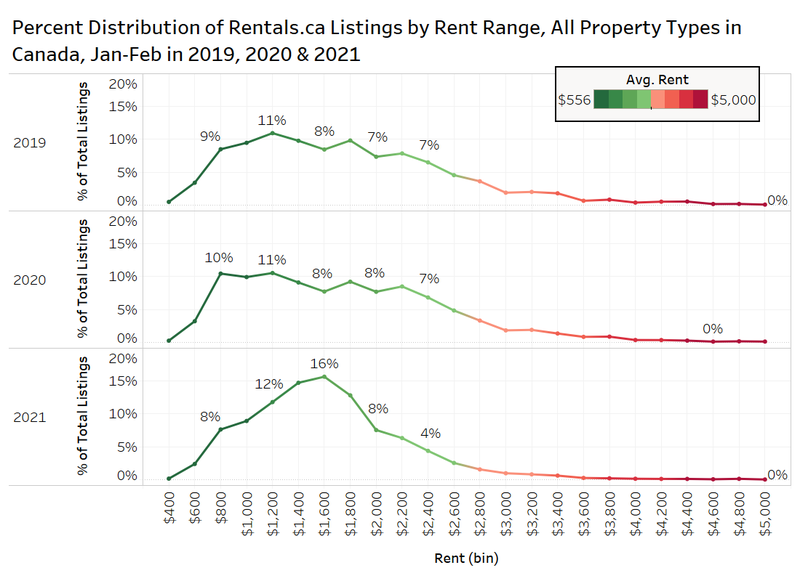 The change in distribution shape and peak around $1,600 is due to a variety of factors. The Toronto units getting cheaper is clearly a factor, but the bottom of the market has continued to get more expensive, as there are fewer $800-to-$1,000-per-month rentals.
Listings and Pageviews by Bedroom Type
The following chart looks at the market share of listings and pageviews on Rentals.ca over the last two years.
Anecdotally, landlords have mentioned an increase in interest in larger units and a decrease in interest in smaller units during the pandemic, as people look for property with more space. The listings data appears to back up that notion. On a percentage basis, there are more studio, one-bedroom and two-bedroom listings in February 2021 versus February 2020. There are fewer three-bedroom or four-bedroom and larger listings.
In terms of pageviews, there has been a jump in people looking at studios, with that bedroom type going from just 5% in February 2020 to 17% in February 2021. Pageviews for one-bedroom units have increased as well, going from 30% to 45% year over year. What is likely happening is these units are not leasing and staying listed on Rentals.ca longer, so more people are looking at them and comparing suites to find the best deal.
Pageviews for two-bedroom units have declined from 39% to 25%, which is more difficult to explain because the share of listings is similar to a year earlier, and two bedrooms are typically the most popular unit type across the country.
 The share of pageviews for three-bedroom units was cut in half, which suggests these units are being snapped up quickly, and they are not spending much time on Rentals.ca before being leased.
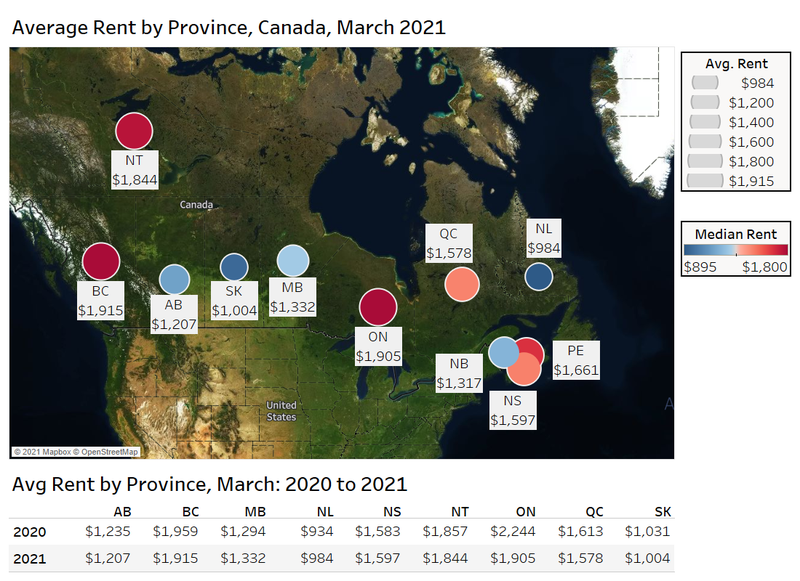
2. Provincial Rental Rates
On a provincial level, British Columbia recorded the highest average monthly rental rate for all property types in February 2021 at $1,954 per month. Ontario had the second highest average monthly rental rate at $1,919 per month. Of the provinces marked on the map below, the lowest average monthly rental rate can be found in Newfoundland at $988 per month.
Out of all the provinces, the average monthly rental rates in Ontario have experienced the largest annual decline, moving from $2,212 per month in February 2020 down to $1,919 per month in February 2021 — a 13% decrease. British Columbia, Manitoba, and Newfoundland are up year over year when looking at this average rent for all property types.
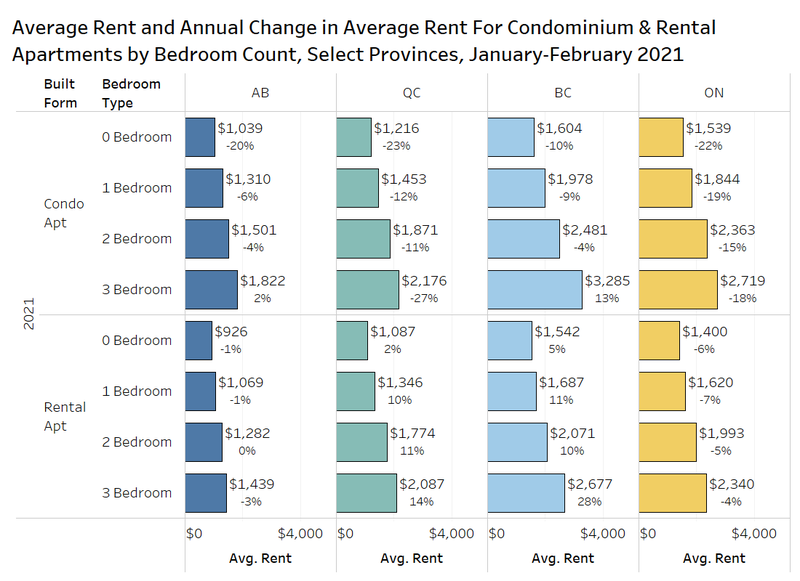
 Average Rent by Property Type and Bedroom Count
The following chart shows the average monthly rental rate and annual change in average rent for condominium and rental units by bedroom count for the provinces of Alberta, Quebec, British Columbia, and Ontario.
Condo apartments have a higher average monthly rental rate for all bedroom types across the selected provinces. Condo apartments in Quebec and Ontario have experienced the largest annual decreases in average rent, while studio condo suites have been hit the hardest with 20% or more annual rent drops in Alberta, Quebec and Ontario.
Three-bedroom condo units in British Columbia experienced an annual increase in average monthly rent by 13% as tenants seek out larger properties while they work from home.
Purpose-built rental apartments in Quebec and British Columbia recorded annual increases in their average monthly rental rate across the board, with three-bedroom rental apartments in British Columbia showing an annual increase of 28%.
Rental apartments in Alberta and Ontario experienced annual declines in their average monthly rent by bedroom type, decreasing between 0% and 7% annually.
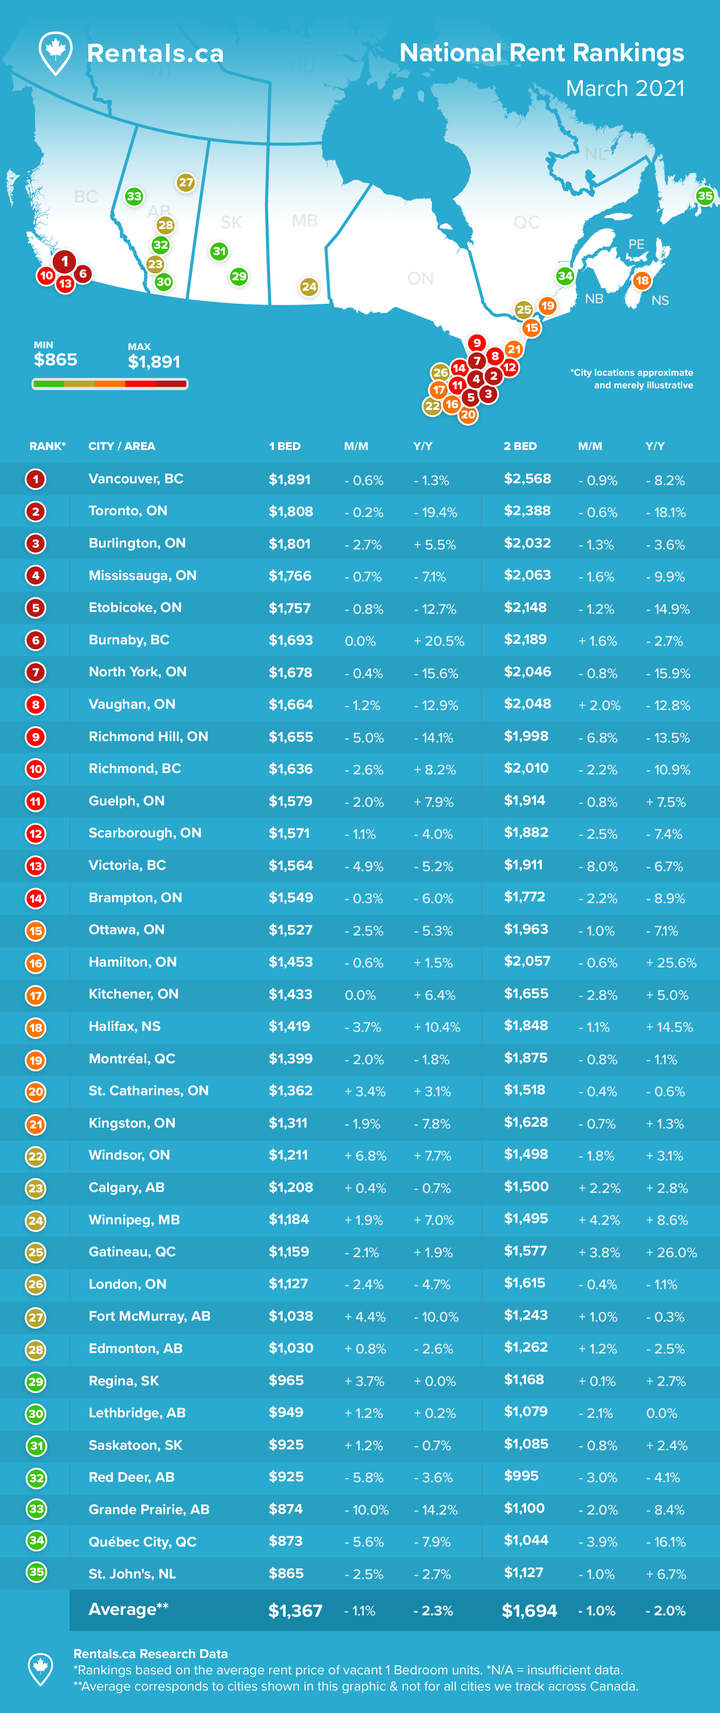
3. Municipal Rental Rates
Asking Rent and Annual Change in Rent for Condo Rentals and Apartments
The following chart looks at the asking rent and annual change in rent for condo and rental apartments across the most active municipalities in Canada via Rentals.ca listings in February 2020 and February 2021.
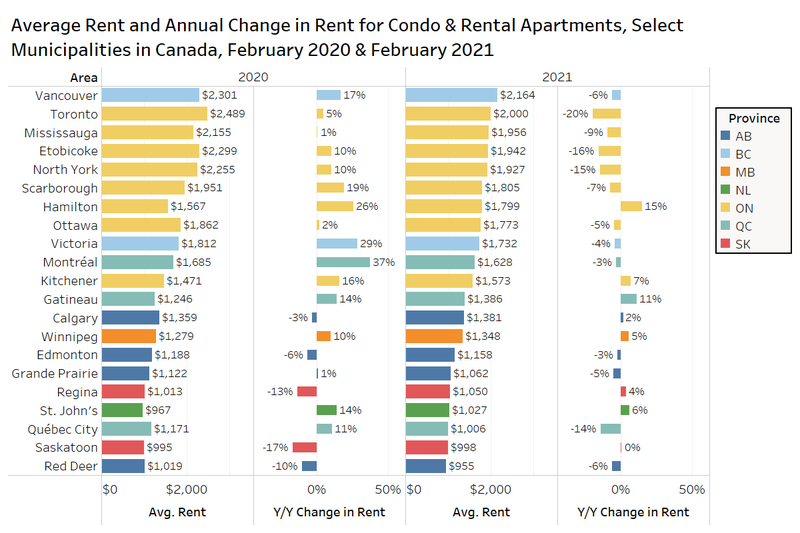 Vancouver and Toronto are the top two municipalities in terms of average monthly rental rates, while Saskatoon and Red Deer sport the two lowest average monthly rental rates. Seven out of the top eight cities and areas with the highest average monthly rental rates are in Ontario.
The majority of the municipalities experienced an annual decline in average monthly rental rates. Toronto recorded the largest annual decline in monthly rental rates, decreasing by 20% from February 2020 to February 2021 — rents had increased 5% annually in the year before. Hamilton, on the other hand, is one of the few municipalities that posted an annual rise in average monthly rental rate, showing an increase of 15%.
In Quebec, Montreal was down 3% annually, and Quebec City was down 14% annually, but Gatineau was up 11% annually.
Average Asking Rent By Built Form for Toronto and Vancouver
The following chart shows the average monthly rental rates for all property types in the top two priciest municipalities in Canada — Toronto and Vancouver (two-month moving average).
Condo apartments and single-family homes in Toronto and Vancouver both experienced steep declines in their average monthly rental rates. Condo apartment and single-family rents peaked in late 2019, and have since steadily declined likely due to the pandemic and COVID-19 lockdowns. Single-family homes in Vancouver had a bounce back between the first and second waves, but have begun to trend down again.
By comparison, rental apartments have not experienced the same steep decline as singles and condos. Vancouver has been most flat over the past 18 months, while Toronto rent growth was strong at the end of 2019 and into 2020 prior to the pandemic hitting. Exacerbating the rental market decline in Toronto recently has been the addition of new supply, as 2,254 new rental apartments were completed over the final four months of 2020 per data from the Canada Mortgage and Housing Corporation.
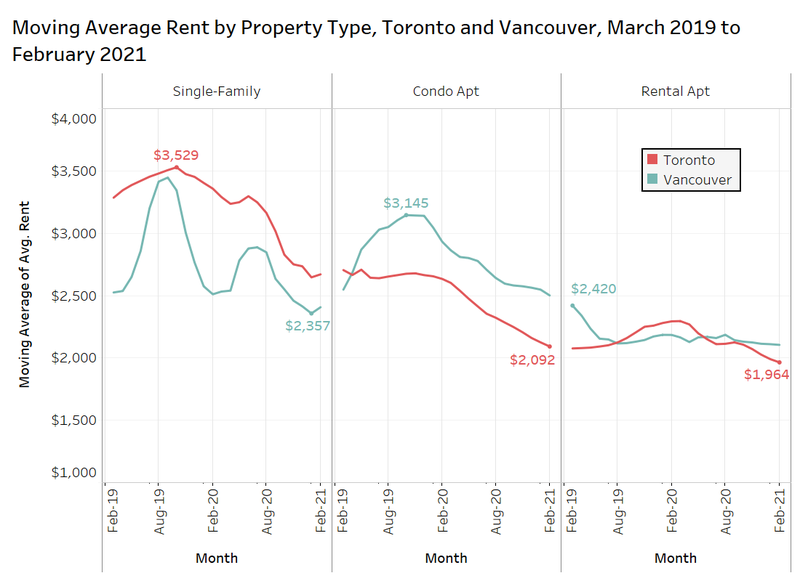 The average rental rates for townhouses in Toronto and Vancouver is where the two cities differ. Prices in Toronto have remained fairly steady since 2019, with minimal movement up or down. Vancouver, on the other hand, has seen its average monthly rental rate skyrocket heading into early 2020, before experiencing a sharp drop mid-2020. Since then, the prices have jumped back up to pre-pandemic rents and have settled at their currency levels of around $3,500 per month.
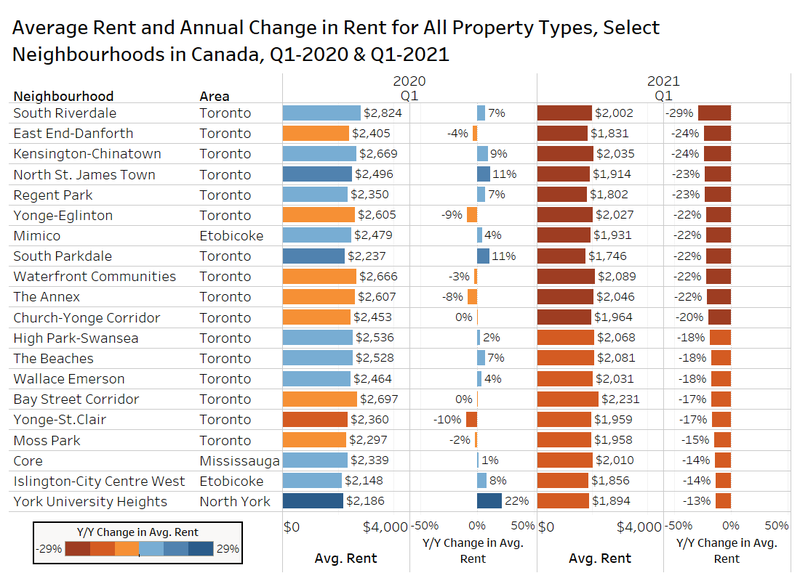
Neighhourhood Rent Levels
The chart below looks at some individual neighbourhoods in Canada experiencing the biggest declines in average rent levels over the past year. The average rent and annual change in average rent is shown for all property types in Q1-2020 and Q1-2021 (the first quarter of this year is January and February only).
All 20 of the worst performing Canadian neighbourhoods are in the Greater Toronto Area, with South Riverdale down 29% annually, the East End-Danforth down 24%, and Kensington-Chinatown also down 24% annually. A renter is looking at rents $600 to $800 per month cheaper than a year earlier.
4. Conclusion
After a year of the COVID-19 pandemic, rental rates might have hit bottom, as the average rental rates in Canada were virtually unchanged month over month. Average rents for single-family, townhouse, and rental apartment properties all increased month over month, but that might simply be the seasonal increase in activity as opposed to a fundamental increase in demand above traditional levels.
It should be reiterated that the data used in this report is asking rents, and the composition of suites has changed, with many more smaller listings than larger listings, which pulls the average rent down.
Many tenants are considering moving and taking advantage of the cheaper rental rates as the number of pageviews on Rentals.ca have increased substantially. Online pageviews in the first two months of 2021 are up 48% over the final two months of 2020. Fear of COVID-19 might have prevented some would-be renters from moving. Now, many tenants have decided that they can no longer put their life on pause and are perhaps starting to see the cheaper rental rates as an opportunity.
Record-low interest rates have encouraged people to buy instead of rent, as Canadians look to lock in the low borrowing costs brought on by the pandemic. However, due to bubble-like conditions in various markets and property types, rumours are swirling regarding government intervention. Should that intervention take place, demand for rentals could increase as prospective buyers put their purchasing decisions on hold.
Some encouraging news on the ramp-up in vaccine delivery over the next couple of months, the easing of lockdown conditions, the return to work for many employees, and an improvement in consumer confidence will likely result in a rental market rebound, but we still believe that is two or three months away.
Rentals.ca Data
The data used in this analysis is based on monthly listings from Rentals.ca. The data is much different than the more familiar numbers collected and published by Canada Mortgage Housing Corporation (CMHC).
Rentals.ca data includes basement apartments, rental apartments, condominium apartments, townhouses, semi-detached houses and single-detached houses, where CMHC’s primary rental data only includes rental apartments and rental townhouses. CMHC collects some data on the secondary market, but it is reported separately.
The CMHC rental rates are based on the entire universe of purpose-built rental units in Canada (the stock), while Rentals.ca data is primarily based on the asking rents of vacated units only (the flow) — this is a smaller sample size, but more representative of the actual market rent a prospective tenant encounters. The Rentals.ca data set typically produces much higher rental rates in comparison to CMHC, as vacated units are not subject to rent control.
The average and median rental rates via Rentals.ca can also skew higher than CMHC’s data for several reasons: The inclusion of larger and more expensive unit types like singles, row units and condos; the survivorship bias (overpriced units remain in the sample longer); and the multiple listings of the same property at different rent levels every month.
It should also be noted that properties listed for above $5,000 a month and below $500 a month are eliminated from the sample of units analyzed. Also, short-term leases, single-room rentals, and furnished rental units are eliminated from the sample where identifiable.

Rentals.ca is Canada’s premier online marketplace for renters and landlords, providing a comprehensive suite of tools and resources tailored to simplify the rental process. With an extensive selection of listings across the country, Rentals.ca offers user-friendly search functionality that helps renters find their perfect home efficiently. For landlords, Rentals.ca delivers effective advertising solutions to maximize visibility and fill vacancies faster. Committed to innovation and excellence, Rentals.ca aims to empower users with up-to-date market insights and expert guidance, making renting easier and more accessible for everyone.