

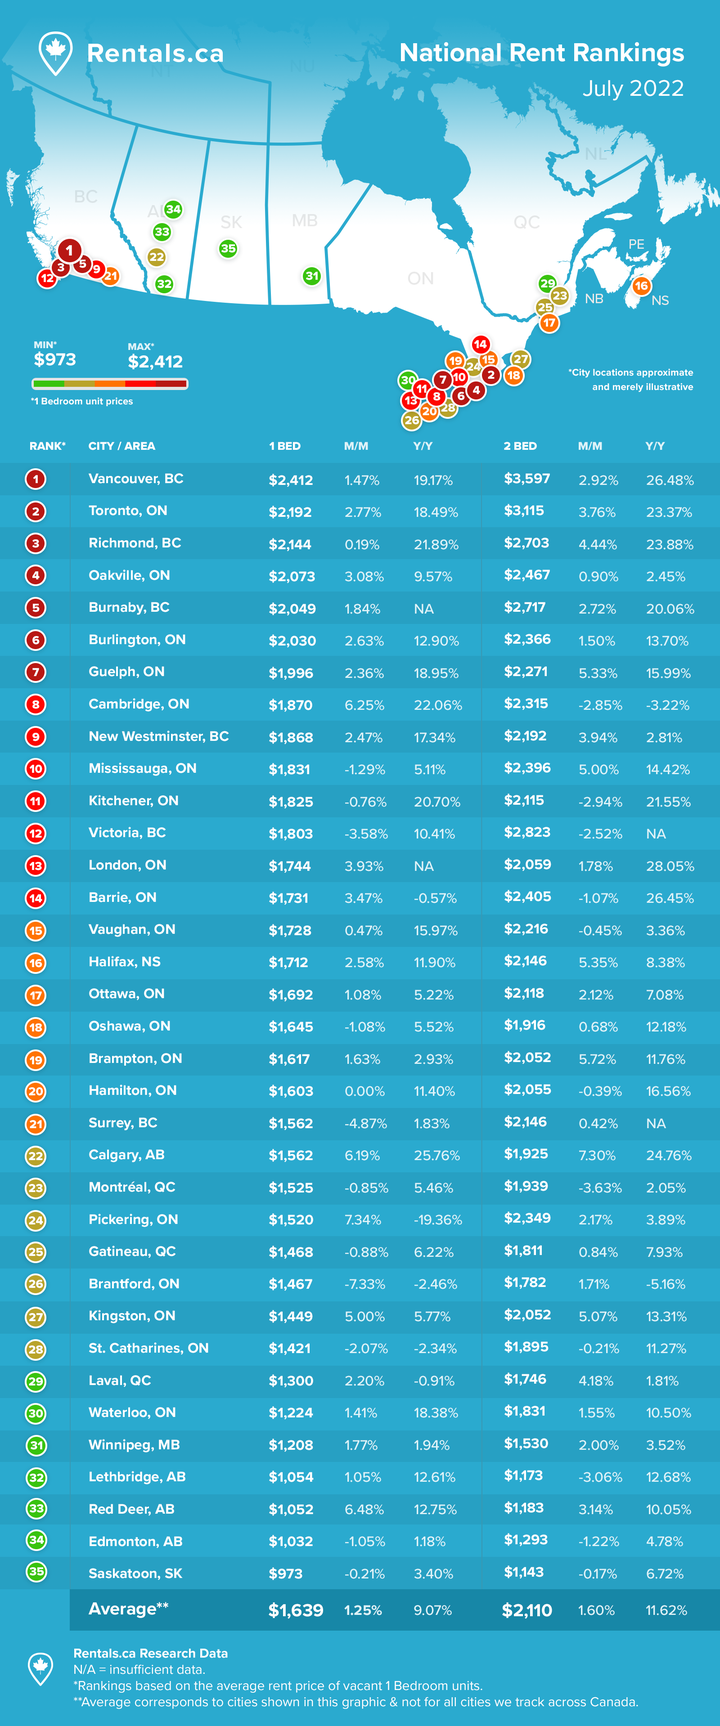
The average rent for all Canadian properties listed on Rentals.ca was $1,885 per month in June 2022, down $3 from May 2022 or down 0.2% month over month. (The data includes single-detached homes, semi-detached homes, townhouses, condominium apartments, rental apartments and basement apartments (outlier listings are removed, as are single-room rentals).
National Overview
The chart below looks at the average rent by month for January to June over the past four years.
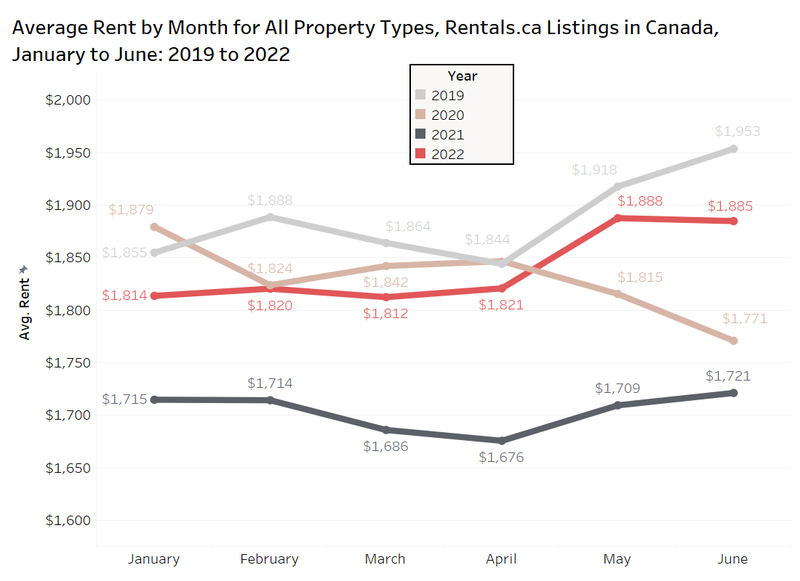
In comparison to last June, the average rent in Canada is up 9.5% annually, but is down 3.5% from June of 2019.
Median Rent by Quarter
The chart below looks at the median rent for all property listings on Rentals.ca aggregated by quarter from Q4-2019 to the second quarter of 2022.
The data shows the median rent in Q2-2022 for all property types was $1,750 per month, representing an annual increase of 7%. After seven consecutive quarters of annual declines (primarily pandemic related: Q1-2020 to Q4-2021), rental prices have now experienced three straight quarters of annual increases.
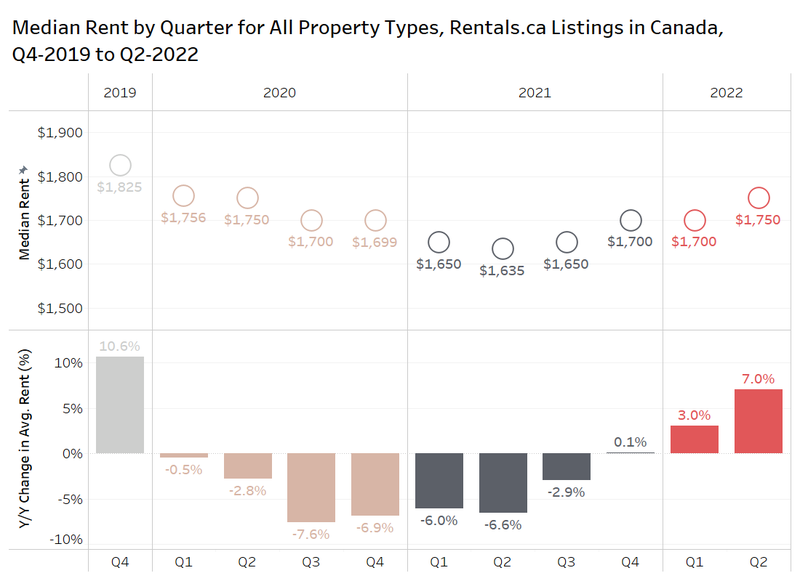
The median rent in Q2-2022 matches Q2-2020, but is down 4% from Q4-2019.
It is important to note that the national average can be impacted by a change in the sample of listings on Rentals.ca, as this report is not looking at a “same sample” of listings month to month. This can lead to false conclusions that the market is softening or the market is heating up, when in reality it could simply be more luxury units were added to the sample of listings, or more small affordable units were offered for rent that month.
A further breakdown of the data by product type, bedroom type and geographic location will help control for some of those shifts in the make-up of the listings.
Average Rent by Property Type and Month
The chart below shows the average rent and average unit size by property type in Canada in June over the past four years based on listings data from Rentals.ca.
The most expensive properties for rent are single-family homes, with landlords asking $2,893 per month on average in June 2022, compared to $2,245 per month for condominium apartments, and $1,685 per month for rental apartments. Rental apartments typically account for about 55% of listings on Rentals.ca, while condo apartments for lease make up about 25%, suggesting that rental apartments best represent the overall conditions in the domestic rental market.
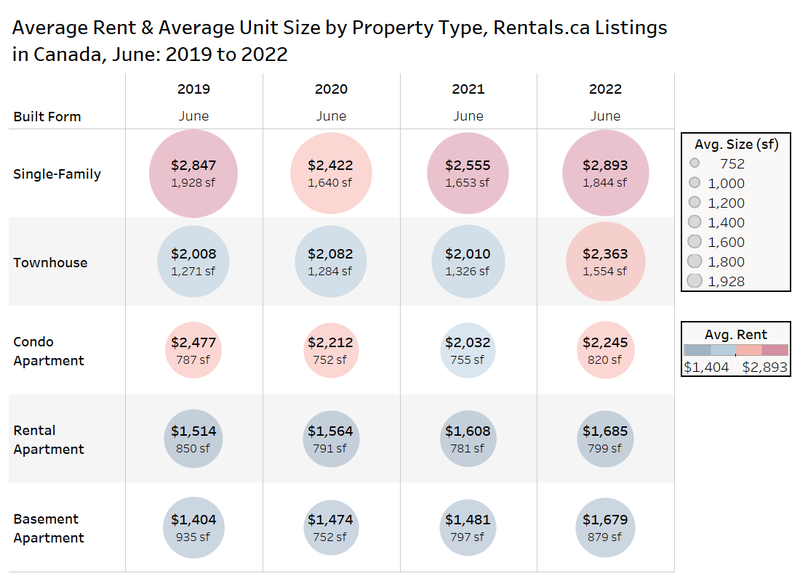
Single-family homes (single-detached and semi-detached) experienced an annual increase in average rent between June 2021 and June 2022 of 13.2% annually.
Condo apartments also experienced a notable increase, rising by 10.5% annually.
Rental apartments, on the other hand, have not experienced the same level of price growth when compared to single-family homes and condo apartments. Rental apartments have seen their average rental rates increase by 5% annually. It is also important to note that rental apartments did not experience the same levels of declines during the pandemic, and some landlords chose to offer incentives or other inducements to attract tenants as opposed to lowering rent.
The average condominium for rent in June 2022 is less expensive than in June 2019 ($2,245 versus $2,477 per month), despite being slightly larger at 820 square feet versus 787 square feet three years ago.
In most months, the average condo for rent is smaller than the average rental apartment, but that was not the case in June 2022, as the average rental apartment was 799 square feet versus 820 square feet for condo apartments.
Average Rent by Bedroom Type
The figure below presents the average rent and the monthly change in average rent for all property types in Canada by bedroom type for May and June of 2021 and 2022.
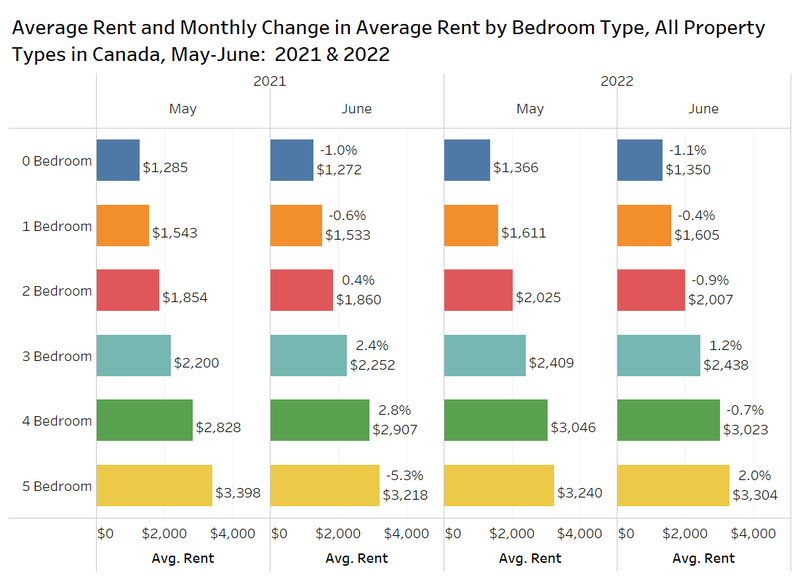
In June 2022, studio, one-bedroom, two-bedroom, and four-bedroom units all saw their average rent decline slightly month over month. Three-bedroom units experienced a monthly increase of 1.2% to $2,438 per month, while five-bedroom units experienced a monthly increase of 2% to $3,304 per month.
Four- and five-bedroom units are primarily larger single-family homes and are a smaller sample size with a wide range of products from a 1,600-square-foot bungalow on a tiny lot in a suburban setting to a 3,000-square-foot home on an oversized lot in an urban setting, which leads to significant rent volatility on a monthly basis.
On an annual basis in June 2022, three-bedroom units have seen average rents grow by 8.3%, while two-bedroom units are up 7.9%, and studios are up 6.1%.
Provincial Overview
The chart below presents data on the average rent for all property types in select Canadian provinces in the second quarter (by month) in 2019, 2020, 2021 and 2022.
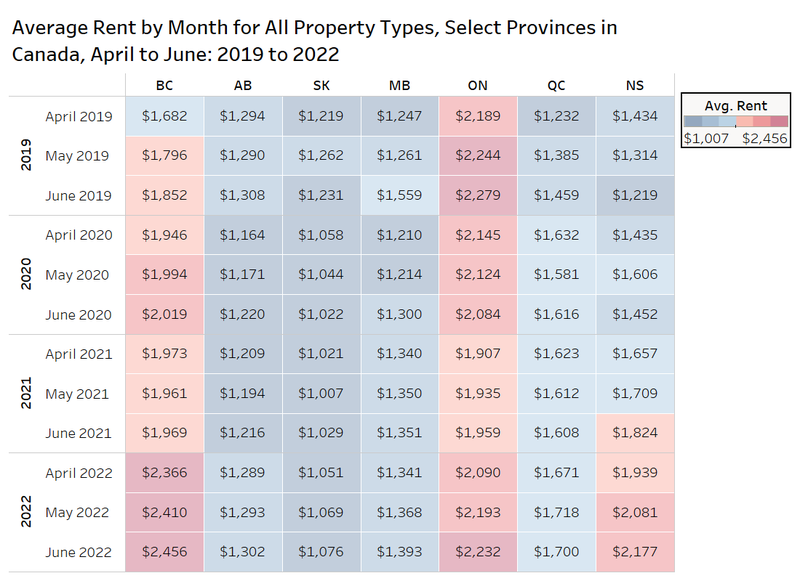
The data shows that British Columbia and Ontario have the highest monthly rental rates at $2,456 per month and $2,232 per month respectively. Nova Scotia also had a relatively high monthly rental rate at $2,177 per month. Ontario rents are up 1.8% monthly, compared to 1.9% in British Columbia and 4.6% in Nova Scotia. On an annual basis, Ontario is up 14%, Nova Scotia is up 19% and British Columbia is up 25%.
The big difference between these areas is rents are less in Ontario in June 2022 compared to June 2019, while British Columbia is up 33% since that time. The sample size of Nova Scotia listings on Rentals.ca was small, so the data is not a reliable indicator of overall market value at the time, however, rents have grown faster than British Columbia during this three-year period.
Saskatchewan and Alberta had some of the lowest monthly rental rates, at $1,076 per month and $1,302 per month respectively, with both areas experiencing monthly and annual rent inflation.
Municipal Rental Rates
The figure below presents the average rent, average rent per-square-foot, and the rank of average number of Rentals.ca pageviews for condo and rental apartments in select municipalities across Canada in June 2022. Note that the rank is from highest to lowest pageviews per listing for these 20 municipalities and former municipalities. The rent per-square-foot is a straight average, not a weighted average.
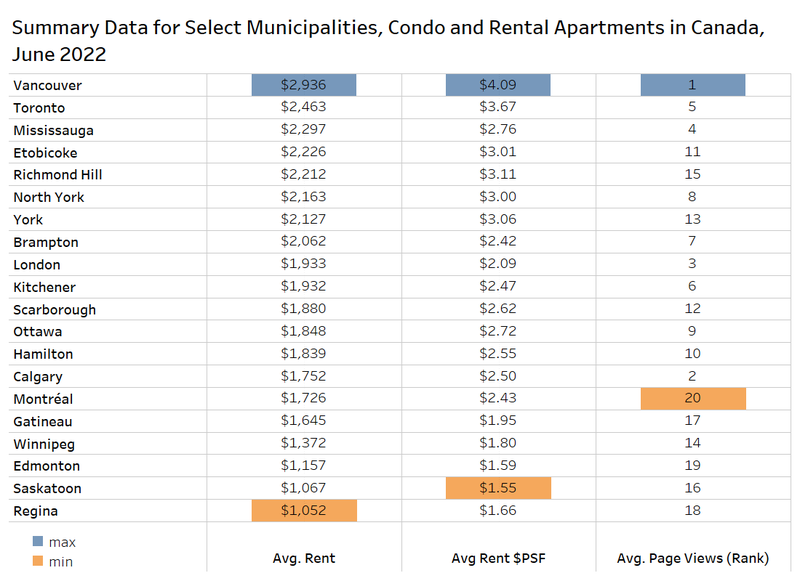
Vancouver had the highest average monthly rental rate at $2,936 per month in June. Many of the municipalities with the highest average monthly rental rate are in Ontario. Regina had the lowest average at $1,052 per month.
Vancouver also had the highest average rent per-square-foot at $4.09, while Saskatoon had the lowest average rent per-square-foot at $1.55.
Rentals.ca tracks the number of pageviews per property and that data can be aggregated at the municipal level. The chart above ranks the average number of pageviews per listing from highest (1) to lowest (20). Montreal was the least popular municipality in June 2022 in terms of average pageviews, while Vancouver was the most popular. Calgary and London were also popular in June. Toronto and Mississauga rounded out the top five in terms of online interest using this pageview metric.
Average Rent and Annual Growth for Condo and Rental Apartments by Area
The chart below looks at the average rent for condominium and rental apartments in select municipalities (and former municipality in the case of Toronto: pre-amalgamation boundaries), in June of 2022 versus June of 2021 and June of 2020. The annual change in average rent is also shown.
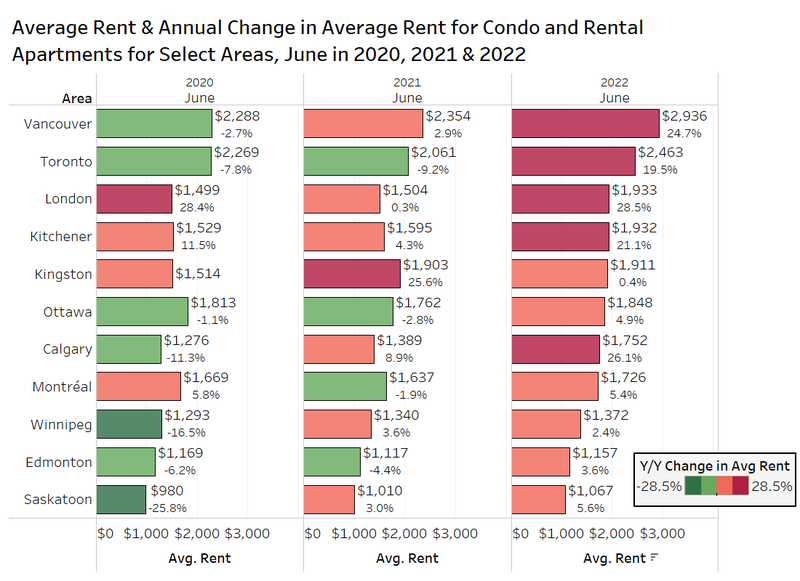
The average rent for condo and rental apartments in Vancouver in June 2022 was $2,936 per month, an increase of 24.7% annually. Vancouver rents were up 2.9% annually one year ago, and down 2.7% in June of 2020.
Toronto rents were up 19.5% to $2,463 per month in June 2022, following a decline of 9.2% annually in June 2021 and a 7.8% annual decline in June 2020.
London, Calgary, and Kitchener also experienced significant increases in average monthly rental rate. London increased 28.5% annually to $1,933 per month, Calgary increased 26.1% to $1,752 per month, and Kitchener increased 21.1% to $1,932 per month.
Average Rent versus Average Unit Size
The following scatter plot looks at the average rent and average unit size for condo and rental apartments in select municipalities and former municipalities in Canada year to date in 2022.
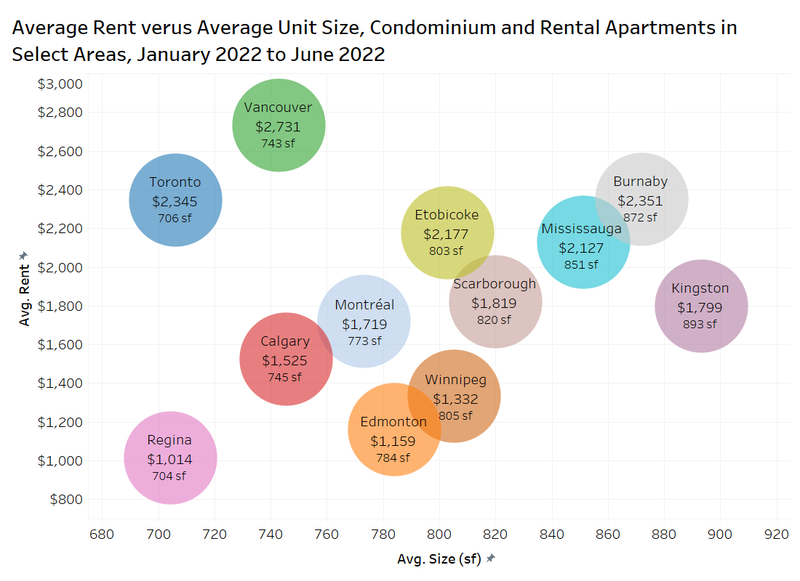
Toronto and Vancouver are outlier municipalities, with the highest monthly rental rates for condo and rental apartments, while having the smallest average unit sizes. These property types in Vancouver had the highest average monthly rental rate at $2,731 per month (743 square feet average size), while Toronto had an average monthly rental rate of $2,345 per month (706 square feet average size).
Regina had the lowest average monthly rental rate at $1,014 per month, as well as the lowest average unit size at 704 square feet.
Burnaby and Kingston had monthly rental rates of $2,351 per month and $1,799 per month, while also sporting the largest average unit sizes at 872 square feet and 893 square feet respectively.
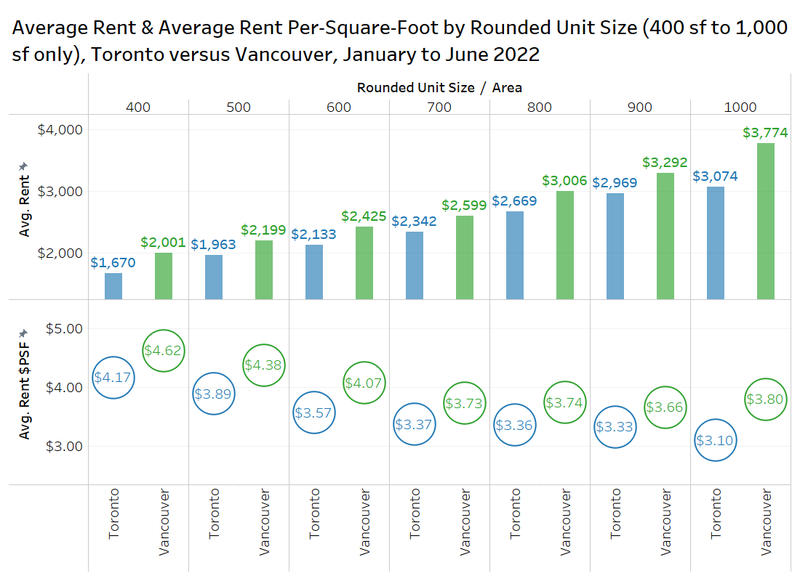
Average Rent and Average Rent Per-Square-Foot by Rounded Unit Size in Toronto versus Vancouver
The chart below compares rent in Toronto and Vancouver for condo and rental apartments by rounded unit size (rounded to the nearest hundred, for units from 350 square feet to 1,049 square feet).
Vancouver is more expensive than Toronto for all unit sizes, with the biggest gap existing for units with a rounded unit size of 1,000 square feet ($700 per month more expensive).
On a per-square-foot basis, Vancouver is also more expensive than Toronto, with the largest gap also occurring in units with a rounded size of 1,000 square feet ($0.69 per square foot).
Average Rent and Average Rent Per-Square-Foot in Vancouver
The figure below presents the average rent and average rent per-square-foot for all property types in Vancouver and several nearby municipalities over the past two years.
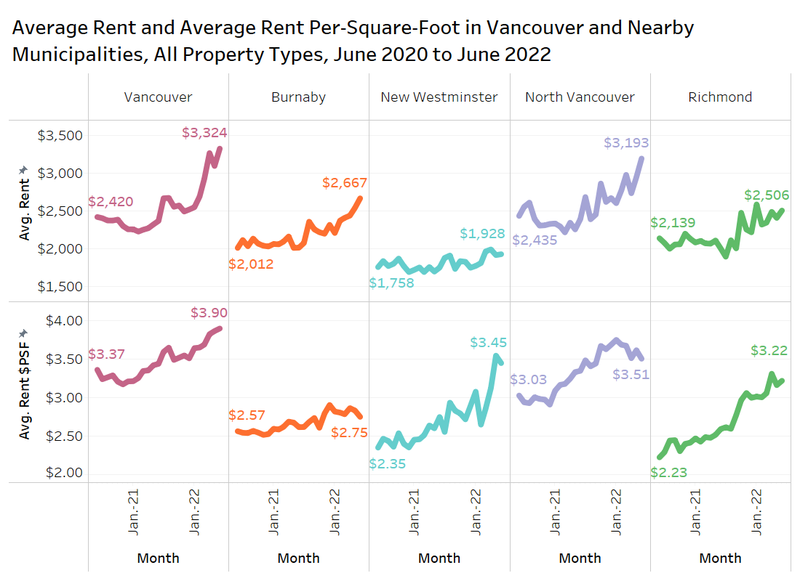
Vancouver and North Vancouver both saw their average monthly rental rate increase significantly between June 2020 and June 2022. Vancouver moved from $2,420 per month in June 2020 to $3,324 per month in June 2022 — an increase of 37%. North Vancouver moved from $2,435 per month in June 2020 to $3,193 per month in June 2022 — an increase of 31%.
New Westminster stayed relatively stable by comparison, increasing by 10% from $1,758 per month in June 2020 to $1,928 per month in June 2022.
New Westminster, however, experienced a significant increase in terms of average rent per-square-foot, moving from $2.35 per square foot in June 2020 to $3.45 per square foot in June 2022 (an increase of 47%). Burnaby on the other hand, saw its average per-square-foot rent increase just 7% from $2.57 per square foot in June 2020 to $2.75 per square foot in June
Conclusion
After seeing a large increase in average monthly rental rates in May 2022 to $1,888 per month, June rent was relatively flat, dropping slightly to $1,885 per month. However, this decline is likely the result of a change in the composition of listings by province, as British Columbia, Alberta, Saskatchewan, Manitoba, Ontario and Nova Scotia experienced monthly increases in rent of 0.7% to 4.6% from May to June.
The recent narrative throughout the pandemic has been that tenants are looking to rent larger units as they work and spend more time at home. This is slowly changing, as the average unit size for listings across all property types has increased in June 2022. The 909-square-foot average unit size for Rentals.ca listings is the highest square footage level since December 2019. This suggests that a higher number of larger units are becoming available and are being listed as the market demands shift.
Vancouver and Toronto remain the most expensive municipalities to rent a condo or rental apartments. In June 2022, Vancouver had an average rent of $2,936 per month (+25% Y/Y), while Toronto had an average monthly rental rate of $2,463 per month (+20% Y/Y). Not surprisingly, these two municipalities also sported some of the smallest average unit sizes at 743 square feet and 706 square feet respectively. Vancouver was the most popular municipality on Rentals.ca for pageviews per listing in June, with Toronto coming in fifth.
There are many moving parts that can affect the housing market across Canada, including rising interest rates, persistent inflation, supply chain issues, and employers’ decisions about requiring in-office work. The recent report by the Canada Mortgage and Housing Corporation suggests Canada remains significantly undersupplied for housing, which continues to impact rental markets, and migration patterns (out-migration from Ontario to Nova Scotia is likely the largest factor impacting the rent spike in that province).
While it is difficult to forecast during these unpredictable times, Bullpen Research & Consulting and Rentals.ca expect rent growth to continue, especially with a resale housing market correction underway, and future interest rates hikes still on the table.
Rentals.ca Data
The data used in this analysis is based on monthly listings from Rentals.ca. The data is much different than the more familiar numbers collected and published by Canada Mortgage Housing Corporation (CMHC).
Rentals.ca data includes basement apartments, rental apartments, condominium apartments, townhouses, semi-detached houses and single-detached houses, where CMHC’s primary rental data only includes rental apartments and rental townhouses. CMHC collects some data on the secondary market, but it is reported separately.
The CMHC rental rates are based on the entire universe of purpose-built rental units in Canada (the stock), while Rentals.ca data is primarily based on the asking rents of vacated units only (the flow) — this is a smaller sample size, but more representative of the actual market rent a prospective tenant encounters. The Rentals.ca data set typically produces much higher rental rates in comparison to CMHC, as vacated units are not subject to rent control.
The average and median rental rates via Rentals.ca can also skew higher than CMHC’s data for several reasons: The inclusion of larger and more expensive unit types like singles, row units and condos; the survivorship bias (overpriced units remain in the sample longer); and the multiple listings of the same property at different rent levels every month.
It should also be noted that properties listed for above $5,000 a month and below $500 a month are eliminated from the sample of units analyzed. Also, short-term leases, single-room rentals, and furnished rental units are eliminated from the sample where identifiable.

Rentals.ca is Canada’s premier online marketplace for renters and landlords, providing a comprehensive suite of tools and resources tailored to simplify the rental process. With an extensive selection of listings across the country, Rentals.ca offers user-friendly search functionality that helps renters find their perfect home efficiently. For landlords, Rentals.ca delivers effective advertising solutions to maximize visibility and fill vacancies faster. Committed to innovation and excellence, Rentals.ca aims to empower users with up-to-date market insights and expert guidance, making renting easier and more accessible for everyone.