

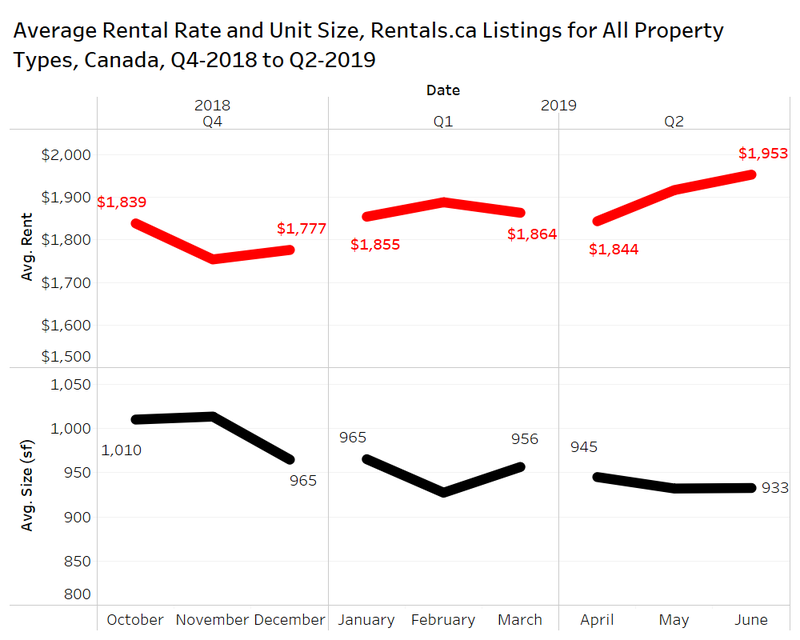
The average property listed on Rentals.ca in June was offered for rent for $1,953 per month, an increase of 1.9% month-over-month. The median asking rent in June of $1,875 per month is up from May ($1,800).
The average size of units for rent in Canada has been slowly trending downward since late last year, from 1,010 square feet (sf) in October 2018 to 933 sf in June 2019.
National Overview
 Given the fluctuations that can occur with monthly readings, this Rentals.ca National Rent Report will also look at the quarterly data to smooth out the “lumps” in the results with a larger three-month sample size.
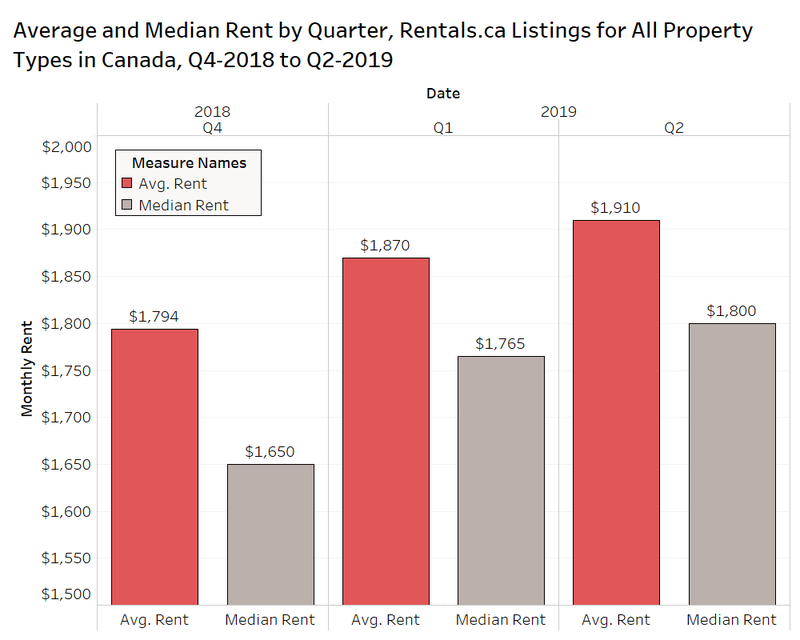
The average property listed on Rentals.ca in the second quarter of 2019 was offered for $1,910 per month, an increase of 2.1% over Q1-2019. The median rental rate was $1,800 per month, which represents a jump of 2.0% quarter-over-quarter. Despite a smaller unit being offered on average, rents continue to increase.
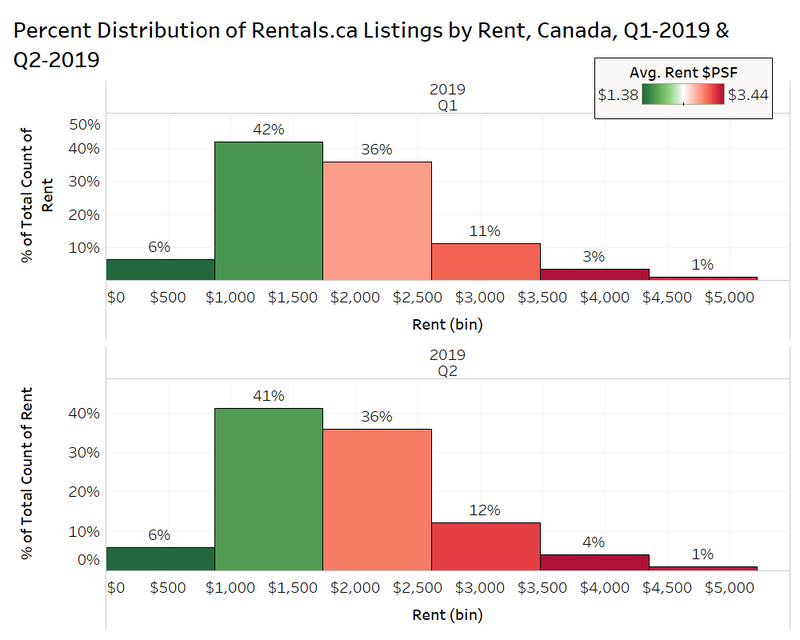
 To get a sense of what accounted for the rent changes on a quarterly basis, we can look at a percent distribution of the rents by quarter.
The share of properties for rent from about $1,000 to $1,750 per month declined from 42% to 41% from Q1-2019 to Q2-2019, while market share was gained in the $2,500 to $3,500 and $3,500 to $4,250 rent ranges. The luxury segment of the market, rents from $4,250 a month to $5,000 per month, remained unchanged at just 1% of the listings on Rentals.ca.
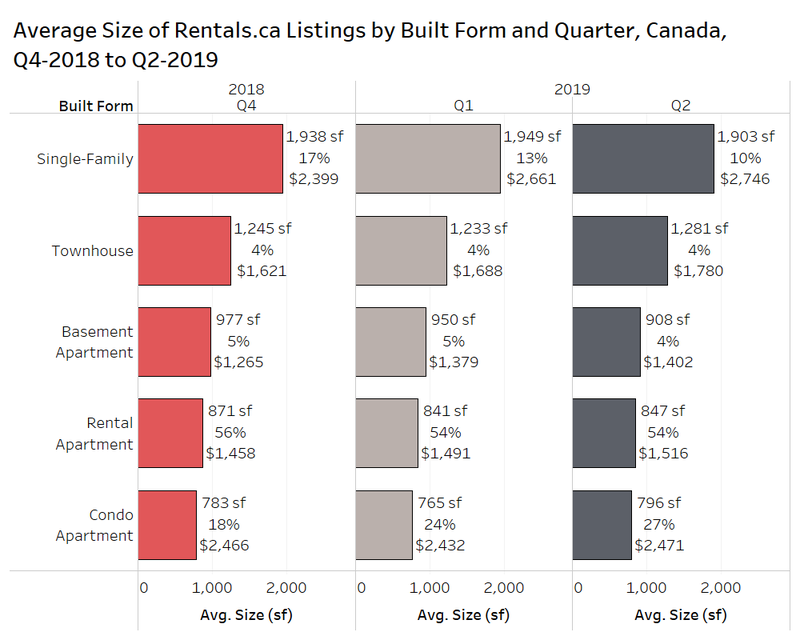
 Another factor to consider when looking at changes in average rents is how the composition of the units in the sample has changed. This is especially important with the Rentals.ca data because property types range from basement apartments under 500 sf to single-detached homes on large lots over 3,000 sf. Not all of the listings on Rentals.ca have their unit sizes available, but the sample is large enough to create a reasonable representation of the total.
The average rental rates in Canada went up quarterly, despite the fact that the share of (higher-rent) single-family homes declined from 13% to 10% quarterly, while the average single-family house listed was also smaller, declining from 1,949 sf to 1,903 sf.
On the flip side, the market share captured by condominium apartments has increased from 18% in Q4-2018 to 24% in Q1-2019 to 27% in Q2-2019. However, the average condo listed for rent on Rentals.ca in the second quarter was slightly larger than the previous two quarters at 796 sf, versus 783 sf and 765 sf respectively.
In terms of quarterly rent growth, townhouses experienced the biggest increase at 5.4%, but greater rent volatility is expected quarterly when the sample of transactions is smaller — townhouses accounted for just 4% of listings on Rentals.ca from April to June.
Single-family properties (which is comprised of single-detached and semi-detached homes) experienced quarterly rent growth of 3.2% from $2,661 per month in Q1-2019 to $2,746 per month in Q2-2019.
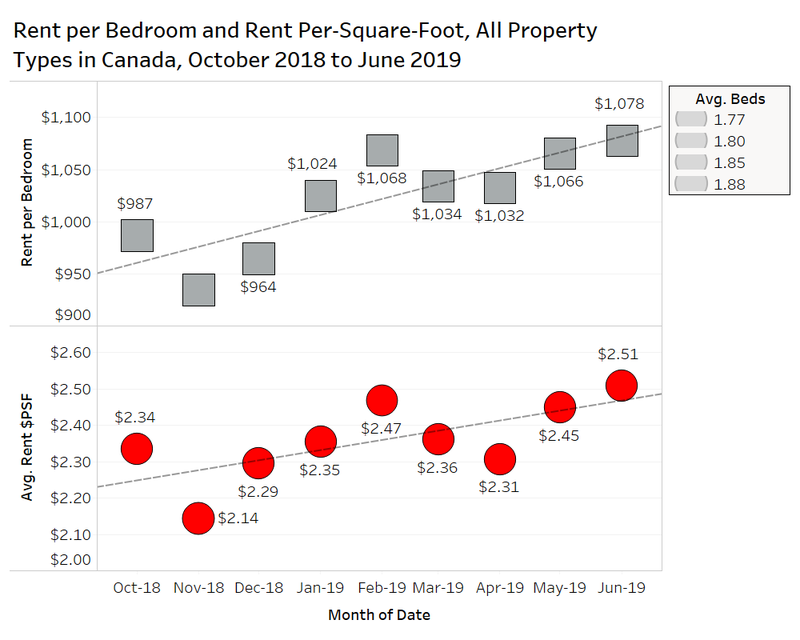
 Another way to control for the monthly or quarterly changes in the composition of the sample, is by looking at “Rent per Bedroom,” which is the total rent over the total number of bedrooms. We can also look at “Rent Per-Square-Foot,” which is a more common measure.
In Canada, it will cost a tenant about $1,078 to rent a bedroom on average, an increase of 1.1% monthly (lower than the growth shown in the first chart). The average listing on Rentals.ca on a monthly basis has ranged from 1.77 to 1.88 bedrooms.
On a per-square-foot basis, the average property listed on Rentals.ca in June was offered at $2.51 per square foot, an increase of 2.4% monthly (higher than the growth shown in the first chart). It is worth keeping in mind that a significant share of the units with square feet included in their listings are located in Ontario.
Provincial Rental Rates
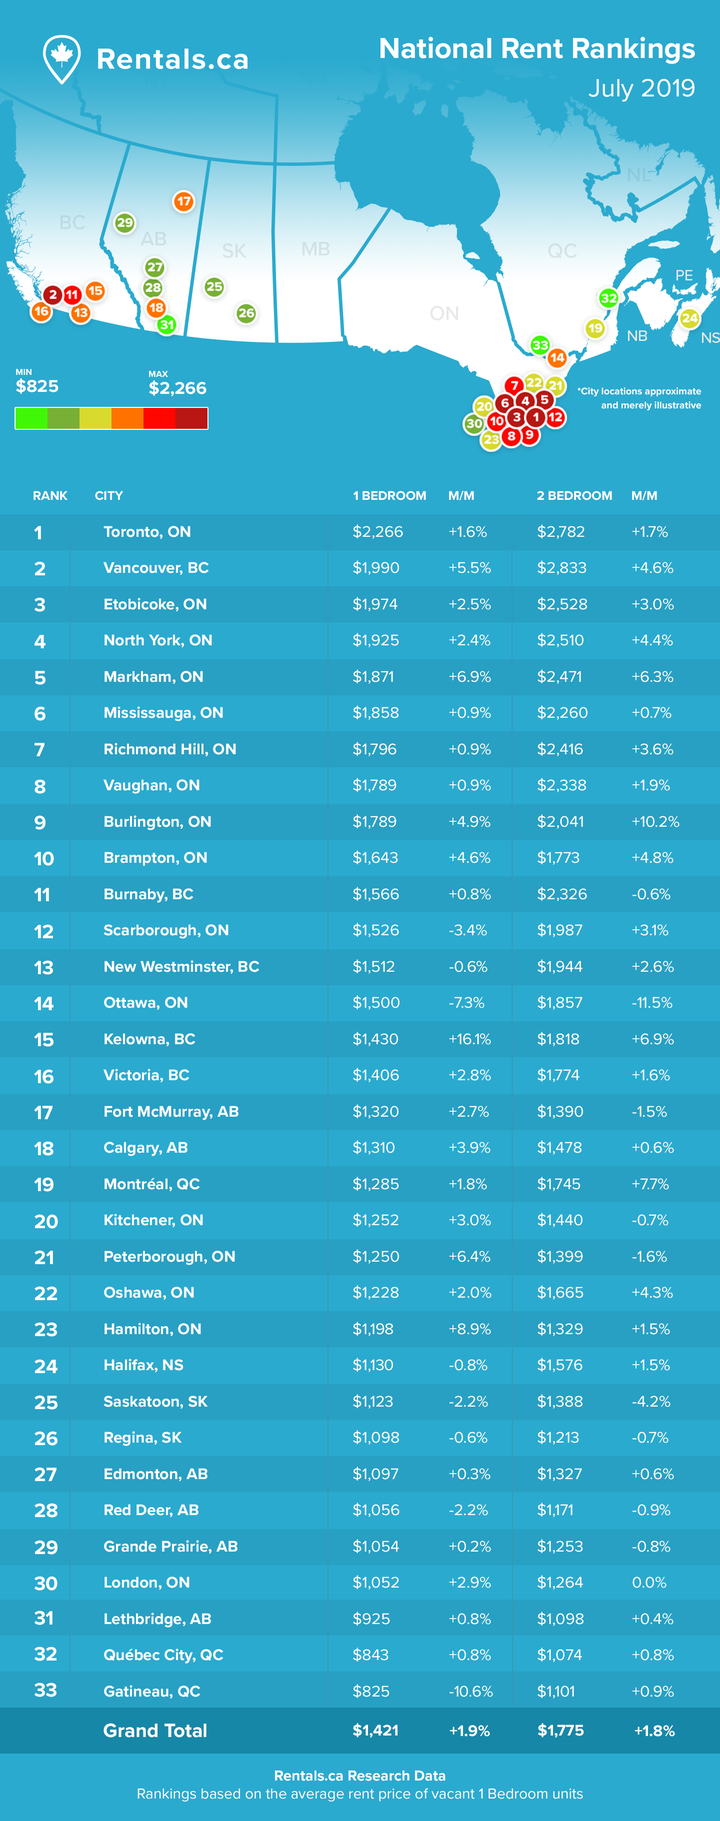
On a provincial level, Ontario had the highest rental rates in June, with landlords seeking $2,279 per month on average (all property types), an increase of 1.6% from May ($2,244). In British Columbia, the average asking rent was $1,852 per month, an increase of 3.1% month-over-month. Asking rents in Alberta increased in June after two consecutive months of decline to $1,308 per month.
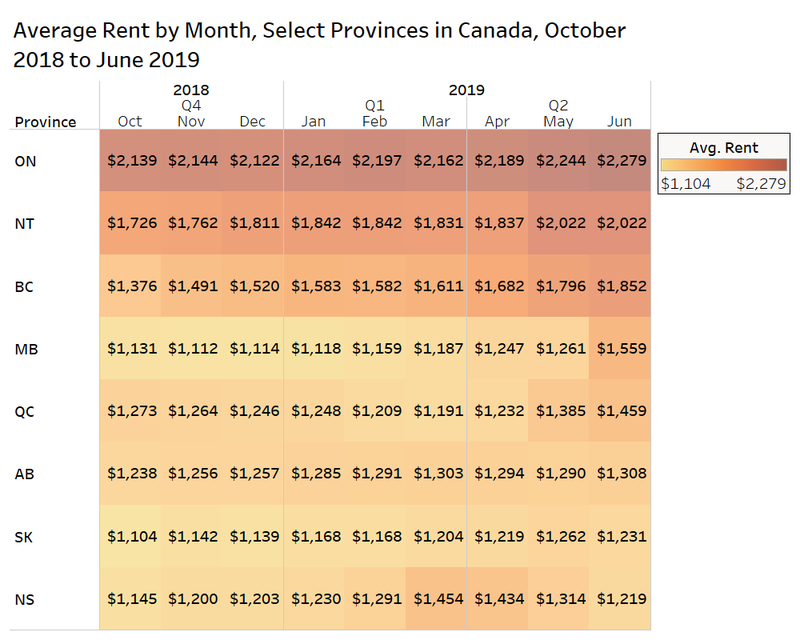 There was a noticeable jump in rents in Manitoba, and surprisingly, much of the jump can be attributed to just one project with a lot of listings, despite the reasonably sized sample of transactions in the province.
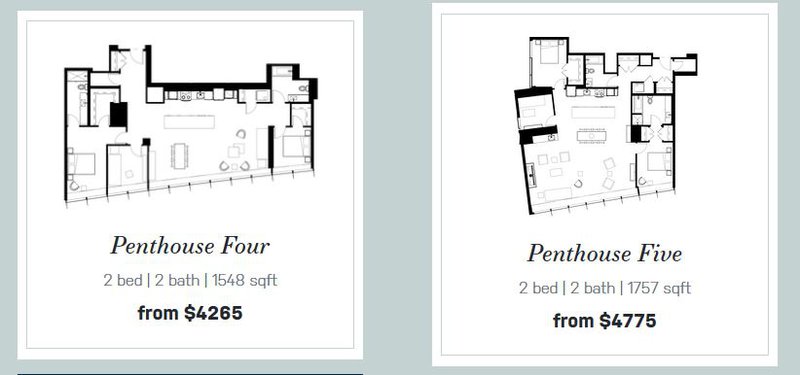
True North Real Estate Development and Bentall Green Oak Residential Services began their leasing program at 225 Carlton, a new high-end rental apartment project in downtown Winnipeg that starts occupancy in the summer of 2019. This rental building is part of the larger True North Square mixed-use project, which is one of the most significant new development projects in Winnipeg’s history.
The 483 sf one-bedroom unit starts at $1,230 per month, but also listed are several penthouse units that really pulled average price levels up for Winnipeg apartments for rent, as the largest suite is 1,757 sf for $4,775 per month. The development is offering one month free rent as a promotion.
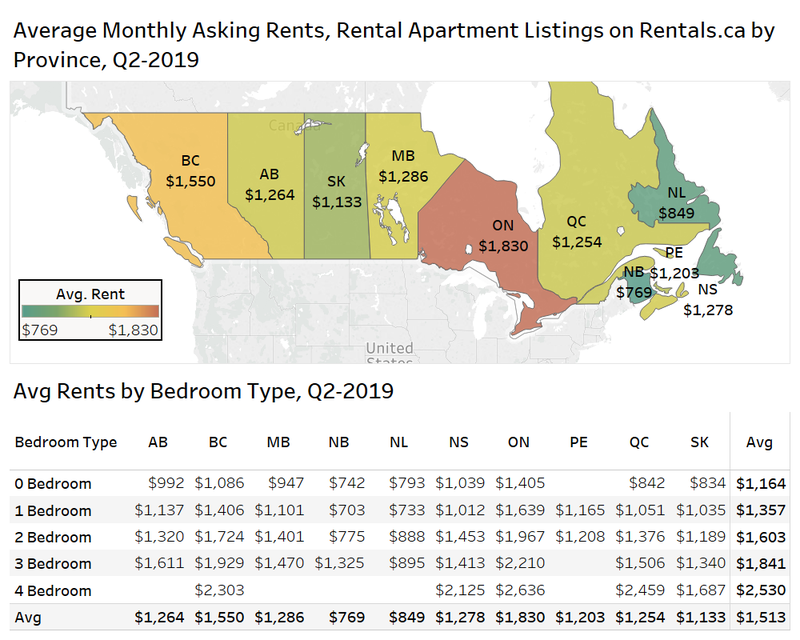
 Comparing average rents across provinces can be tricky given the differing rental product offered in each province. The chart below looks at average monthly asking rents overall (for rental apartments only), and by bedroom type in the second quarter.
Rental apartments in Ontario were being offered at $1,830 per month on average in Q2-2019, almost $300 more per month than British Columbia. The premium in Ontario over British Columbia is smaller for one-bedroom and two-bedroom units at around $250 per month.
Municipal Rental Rates
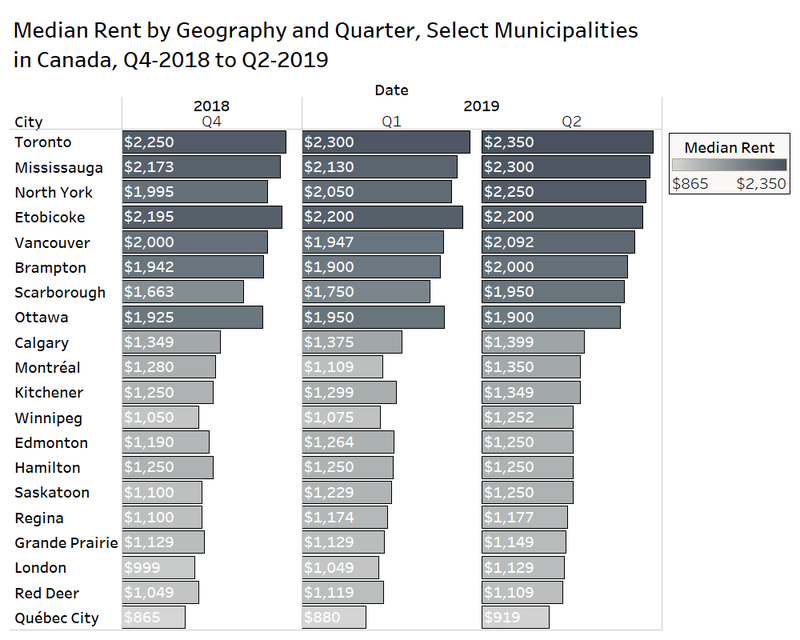
The chart below shows how median rental rates have changed in various municipalities in Canada on a quarter-over-quarter basis. Median rents are used to eliminate outliers. An example of outliers include the penthouses at 225 Carlton in Winnipeg, which can skew the results.
The median rent was the same or higher in most of the major municipalities in Canada, with the exception of Ottawa, Edmonton, and Red Deer.
GTA Insights
There has been much discussion recently about the role that condominium investors play in the rental market in Toronto, as recently released data from Statistics Canada shows that 37% of condominium apartments in the Toronto Census Metropolitan Area (CMA) are not owner occupied.
Data released by Canada Mortgage & Housing Corporation (CMHC) last year shows that 33% of condominiums in the Toronto CMA are leased, with a miniscule vacancy rate of just 0.7%. Investors provide a valuable service of creating new rental supply, as the economics of building rental apartments in the GTA is difficult given the high land costs, high construction costs, rising development charges, large upfront investment, uncertain future interest rate environment, tougher lending criteria, and continued government intervention in the landlord space. The increase in purpose-built rental apartment construction is related to the sharp rise in rental rates, especially condo rental rates.
Greater Toronto Area condominium apartments for lease continue to see rent growth, with the average rent hitting $3.10 per square foot in June 2019, up 1% month-over-month.
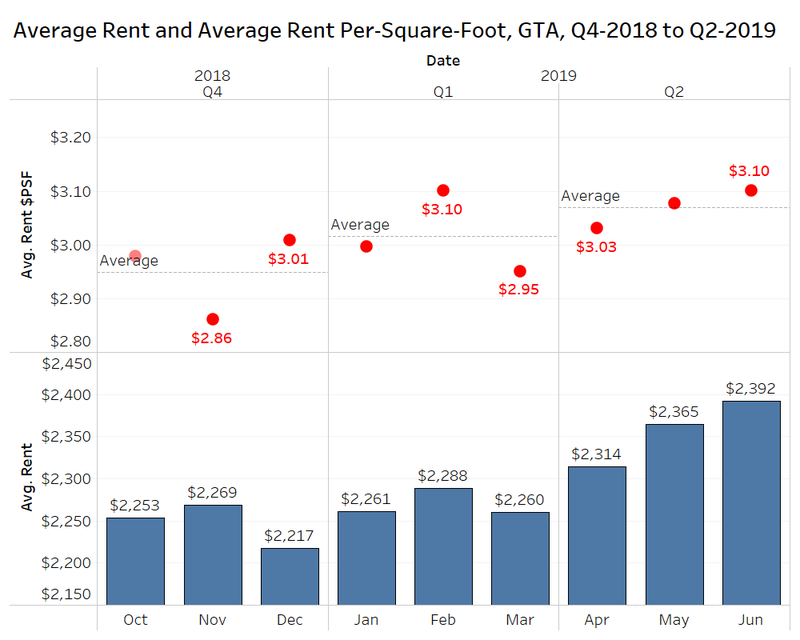 On an absolute basis, average condo rents increased by 1.1% to $2,392 per month, from $2,365 in the second quarter.
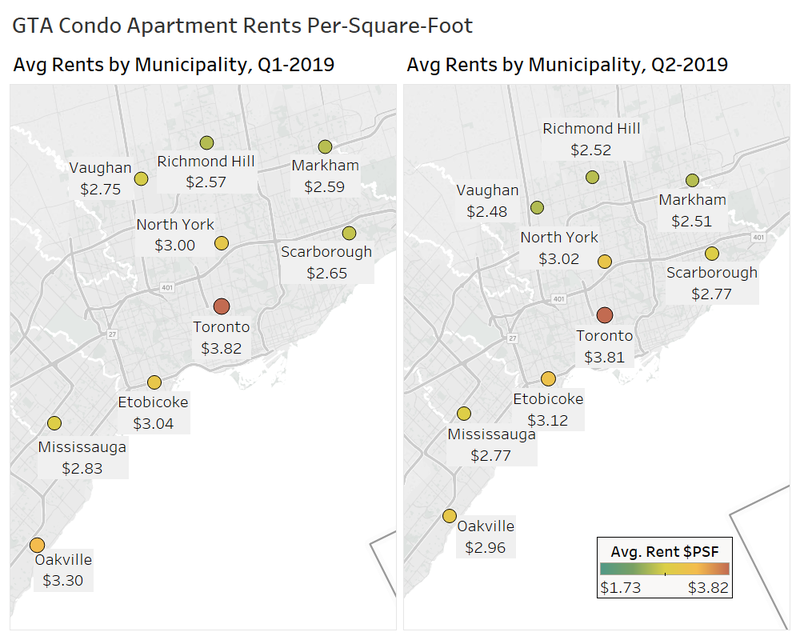
When breaking down the condo rental rates by municipality in the first and second quarter, City of Toronto condo rents are virtually unchanged (old Toronto boundaries, pre-amalgamation), but all three of the major York Region municipalities experienced declines. However, the former municipalities of Scarborough, North York and Etobicoke in the “outer-416” area all experienced increases in condo rents quarter-over-quarter.
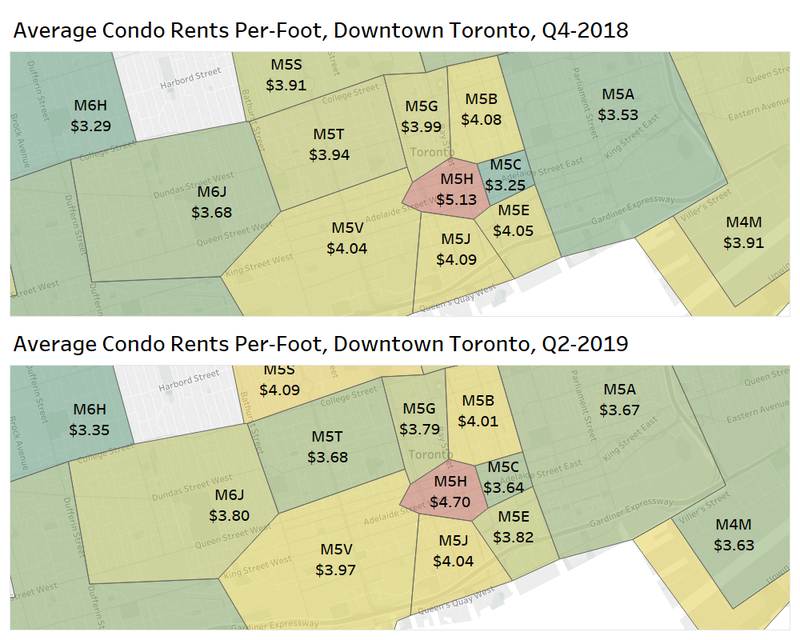
 Comparing condo rental rates in several of the prime downtown postal codes in Toronto shows that the investor condo market is softening, as almost all of the areas are experiencing lower asking rent per square foot in Q2-2019 versus Q4-2018, with the exception of M6H and M6J in the downtown west area.
A higher number of new condo completions were expected in 2019, which would add more rental investor supply, but data from CMHC has yet to show that influx. To investigate further, it is worth looking at rental rates in individual condo projects.
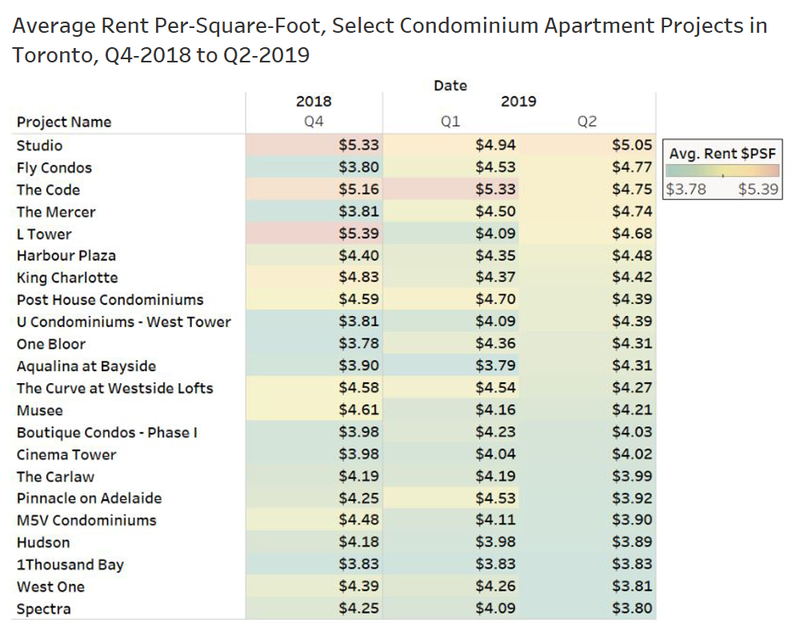
 The chart below looks at average rents per square foot at a selection of condominium apartment projects in Toronto with at least three listings in each of the last three quarters.
Studio is a recently completed two-tower condo development by Aspen Ridge Homes near University Avenue and Richmond Street West. Landlords are asking $5.05 per square foot for suites in this project in Q2-2019, up from $4.94 per square foot in the first quarter.
Fly Condos off Front Street near Blue Jays Way was completed by Empire Communities a few years ago and is leasing units at $4.77 per square foot in Q2-2019 compared to $4.53 per square foot in the first quarter, but there were only three listings on Rentals.ca from April to June.
One of the most active developments on Rentals.ca in the third quarter was Harbour Plaza, a major mixed-use development with two towers just south of the Gardiner Expressway at Harbour and York Streets. The 29 listings on Rentals.ca averaged $4.48 per square foot in Q2-2019, up from $4.35 per square foot on average in the first quarter.
Overall, these projects experienced a 1% rent decline quarter-over-quarter.
Several of the projects in the downtown core are achieving higher per-foot rents than Yorkville’s One Bloor, and the Waterfront’s Aqualina at Bayside, as both projects have average per-foot rents of $4.31 in Q2-2019. For an investor, purchasing a luxury apartment unit in Yorkville or on the waterfront has not resulted in premium rental rates.
Ottawa Insights
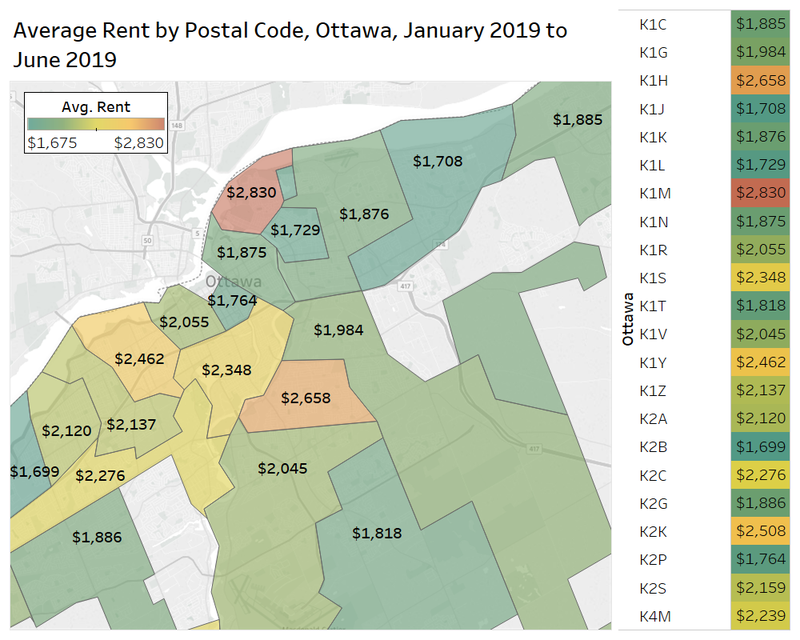
The map below shows the average rent by postal code in Ottawa using listing data from Rentals.ca over the past six months.
The highest rents are in postal code K1M, that includes the Rockcliffe Park and New Edinburgh areas at $2,830 per month.
The second highest rents are in K1H, the Alta Vista community at $2,658 per month. These areas had higher concentrations of single-family listings.
One of the areas with the lowest rents is K2P, which includes the Centretown area, right beside downtown at $1,764. Almost all of the listings in K2P are rental apartments, and there are no single-family or townhouse listings on Rentals.ca in 2019 in this postal code, contributing to the lower rent levels.
K2P was the second most popular postal code on Rentals.ca by page views to neighbouring K1N (Byward Market, Lower Town, Sandy Hill and University of Ottawa).
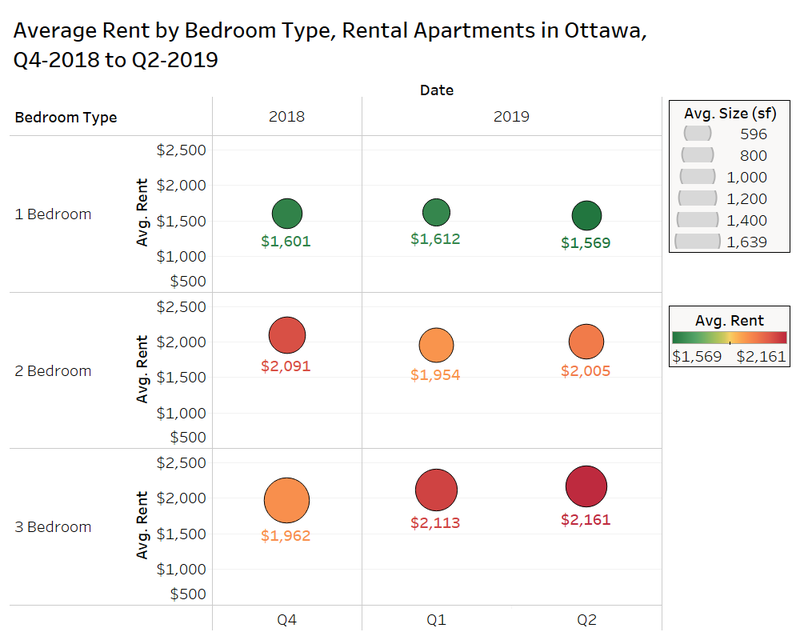
 Rental apartments in Ottawa have not experienced much appreciation in 2019, as the chart below shows average rents by bedroom type over the last three quarters.
One-bedroom rental apartments units were offered at about $1,570 per month on average in Ottawa in Q2-2019, with two bedroom units at $2,005, and three bedroom suites at $2,161.
Conclusion
With children out of school and university students moving back home, June is a prime month for rental listings and rental demand. The average rental rate in Canada for all property types increased for the second consecutive month, however, the average rental rate for rental apartments declined month-over-month, falling from $1,531 per month in May to $1,526 per month in June.
As affordability continues to be a concern, the average size of units offered for rent is shrinking nationally, from over 1,000 square feet in October 2018 to 933 square feet in June 2019. In Toronto, affordability concerns are resulting not only in tenants settling for smaller spaces, but also choosing to share small suites with one or more roommates much later in life than witnessed in more affordable municipalities.
Rentals.ca and Bullpen Consulting will continue to monitor the trends in the market, and the factors that impact rental demand that have been relatively positive over the last year including immigration and population growth, and declines in the unemployment rate.
Rentals.ca Data
The data used in this analysis is based on monthly listings from Rentals.ca. The data is much different than the more familiar numbers collected and published by Canada Mortgage Housing Corporation (CMHC).
Rentals.ca data includes basement apartments, rental apartments, condominium apartments, townhouses, semi-detached houses and single-detached houses, where CMHC’s primary rental data only includes rental apartments and rental townhouses. CMHC does collect some data on the secondary market, but it is reported separately.
The CMHC rental rates are based on the entire universe of purpose-built rental units in Canada (the stock), while Rentals.ca data is primarily based on the asking rents of vacated units only (the flow) — this is more representative of the actual market rent a prospective tenant encounters. The Rentals.ca data set typically produces much higher rental rates in comparison to CMHC, as vacated units are not subject to rent control.
The average and median rental rates via Rentals.ca can also skew higher than CMHC’s data for several reasons: The inclusion of larger and more expensive unit types like singles, row units and condos; the survivorship bias (overpriced units remain in the sample longer); and the multiple listings of the same property at different rent levels every month.
It should also be noted that properties listed for above $5,000 a month and below $500 a month are eliminated from the sample of units analyzed. Also, short term leases, single-room rentals, and furnished rental units are eliminated from the sample where identifiable.

Rentals.ca is Canada’s premier online marketplace for renters and landlords, providing a comprehensive suite of tools and resources tailored to simplify the rental process. With an extensive selection of listings across the country, Rentals.ca offers user-friendly search functionality that helps renters find their perfect home efficiently. For landlords, Rentals.ca delivers effective advertising solutions to maximize visibility and fill vacancies faster. Committed to innovation and excellence, Rentals.ca aims to empower users with up-to-date market insights and expert guidance, making renting easier and more accessible for everyone.