

The average rent for all Canadian properties listed on Rentals.ca in December was $1,789 per month, up 3.8% annually. This is the fourth consecutive month with a positive annual change in average rent following 16 consecutive months of decline.
Rentals.ca January 2022 Rent Report
Rentals.ca January 2022 Rent Report
1. National Overview
The average monthly asking rent for all property types in Canada, including single-family housing, townhouses, rental apartments, condominium apartments, and basement apartments cumulatively from January 2020 to December 2021 is shown in the chart below (red). The annual change in average rent is represented by the grey bars. This data is generated from Rentals.ca listings data.
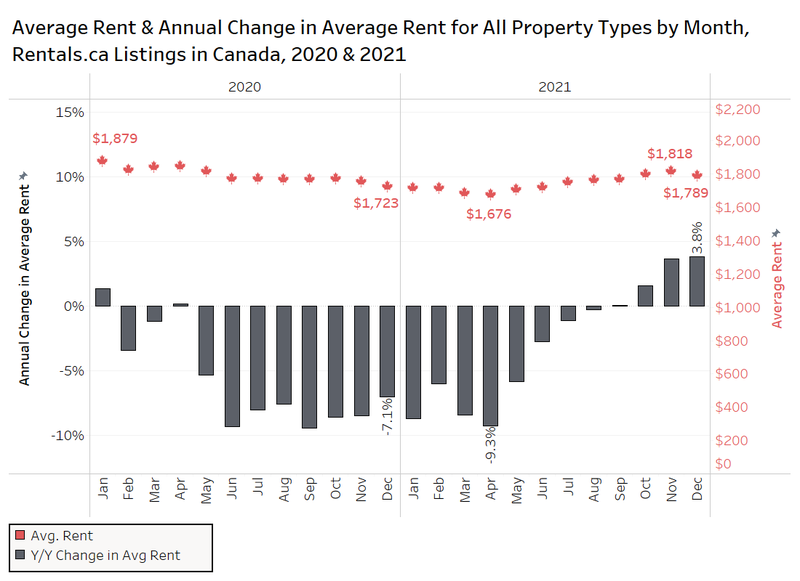
However, for the first time since April, the average rent decreased month over month, falling 1.5% from $1,818 per month in November. Rental rates tend to fall in December as prospective tenants are concentrating on the holidays and not looking for apartments. It is not likely that the Omicron virus was the culprit, as average rents declined 1.8% monthly in December 2020, and 3.3% monthly in December 2019.
National Rental Rates Per-Square-Foot and Quarter
The chart below shows the average rent per-square-foot for all property types in Canada by quarter via Rentals.ca listings data over the past two years (top panel). Also shown is the average rent per-square-foot for condo and rental apartments only by quarter (bottom panel). Not all listings make their unit size available, and those that do tend to skew toward newer properties, thus making the figure likely higher than it would be with a more comprehensive sample.
The average rent per-square-foot for all property types was $2.33 on average in Canada in Q4-2021, an increase of 1.3% annually from the Q4-2020 average of $2.30. The average listing was 877 square feet in the fourth quarter of 2021 versus 847 in Q4-2020. Over the past three years, the market peaked at $2.43 per-square-foot in Q2-2019.
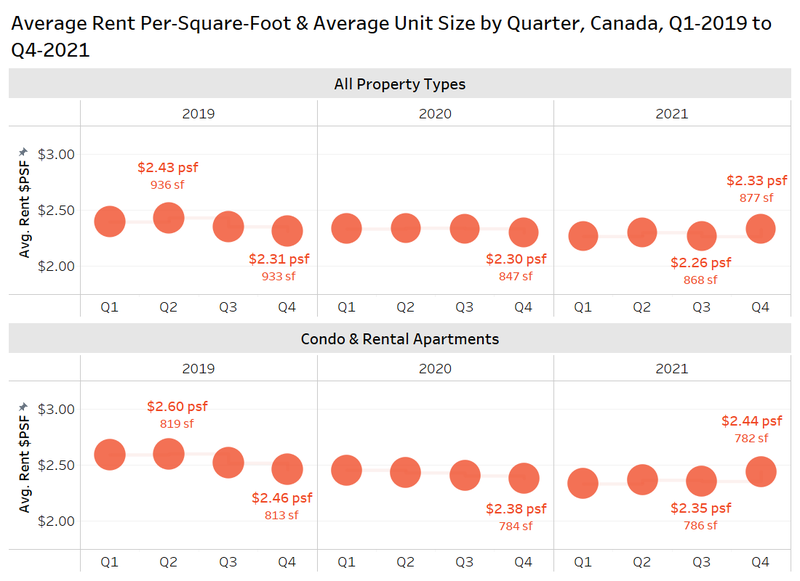
The average rent per-square-foot for condo and rental apartments in Q4-2021 was $2.44, which was an annual increase of 2.5% from the Q4-2020 average of $2.38. The average unit size was virtually unchanged year over year at 782 square feet in Q4-2021 versus 784 square feet a year earlier. Over the last three years, the market peak was Q2-2019 at $2.60 per-square-foot, where the average size was larger at 819 square feet.
Rental Rates by Property Type
The next figure presents data on the average monthly rent, average rent per-square-foot and median rent for single-family properties (single-detached and semi-detached houses), condominium apartments, and rental apartments in Canada via Rentals.ca listings in November and December in each of the last four years.
The average single-family home was offered at $2,546 per month in December 2018, rising 2.2% to just over $2,600 in December 2019. The average rent declined 9.3% in the pandemic-impacted 2020 to $2,360, despite the fact that the average rent per-square-foot was unchanged at $1.66. In December 2021, the average rent for a single-family home was $2,570 per month – an annual increase of 8.9%, but still below pre-COVID-19 highs. However, the average rent per-square-foot declined 6% in December 2021 to $1.56, which reflects the changing composition of single-family listings, which can range from a 900-square-foot bungalow on a small urban lot to a 7,000-square-foot home on a multi-acre lot in a rural setting.
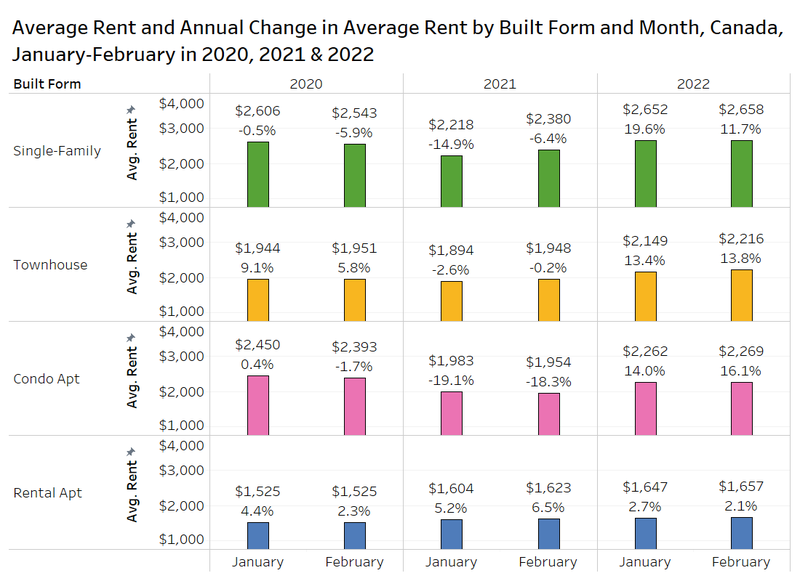
Condominium apartments experienced an annual increase of 11% to $2,227 per month in December 2021. The average rent per-square-foot also experienced an annual increase of 6.9% to $2.96 in December 2021. Condos were hit the hardest during the early pandemic period as some tenants fled the big cities and their expensive housing, with condo rents falling by a whopping 18% annually in December 2020.
Apartments have not experienced the same levels of increases as single-family homes and condo apartments, moving from $1,603 per month in December 2020 to $1,623 per month in December 2021 (an annual increase of just over 1%). The average rent per-square-foot has experienced an annual increase of 4%, moving from $2.20 in December 2020 to $2.29 in December 2021.
Unlike singles and condos, apartments did not experience rent declines in 2020. This likely has to do with more incentives being offered by apartment landlords, like one or two months of free rent, while the landlords and investors who own single-family homes and condos for rent were more likely to simply lower the rent. Secondly, there were a number of new purpose-built rental apartment completions in several cities in 2020, and the slower absorption and lease-up at these projects resulted in these new and expensive apartments having listings on Rentals.ca for longer than normal, giving the impression that average rents were higher.
Rental Rates by Bedroom Type and Property Type
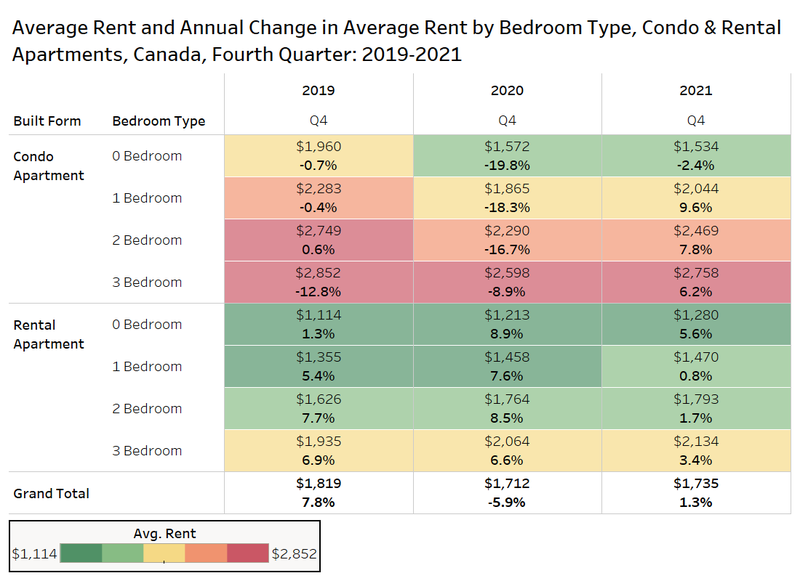
The chart below looks at the average rent and annual change in average rent in the fourth quarter of 2019, 2020 and 2021 for condominium and apartment rental properties nationally.
Overall, the average rent for these two property types combined experienced a slight annual increase of 1.3%, moving from $1,712 per month in Q4-2020 to $1,735 per month in Q4-2021.
For condo apartments, the average rent for a studio unit experienced an annual decline of 2.4% to $1,534 per month in Q4-2021. This is the only bedroom type that experienced an annual decrease in monthly rental rates. One-bedroom condo apartments experienced an annual increase of 9.6% to $2,044 per month; two-bedroom condo apartments experienced an annual increase of 7.8% to $2,469 per month; and three-bedroom condo apartments experienced an annual increase of 6.2% to $2,758 per month. All of the condo bedroom types remain well below Q4-2019 rent levels.
For rental apartments, studio units experienced the highest year-over-year rise by bedroom type with an annual increase of 5.6% to $1,280 per month in Q4-2021. One-bedroom units experienced an annual increase of 0.8% to $1,470 per month; two-bedroom units experienced an annual increase of 1.7% to $1,793 per month; and three-bedroom units experienced an annual increase of 3.4% to $2,134 per month. All bedroom types for rental apartments increased annually in 2020 and 2021.
2. Provincial Rental Rates
The chart below looks at the average rent for all property types by province in Q4-2020 and Q4-2021.
The average rent in British Columbia was up 7.3% annually in 2021 to $2,171 per month. Ontario’s rent increased annually by 5.4% to $2,087 per month.
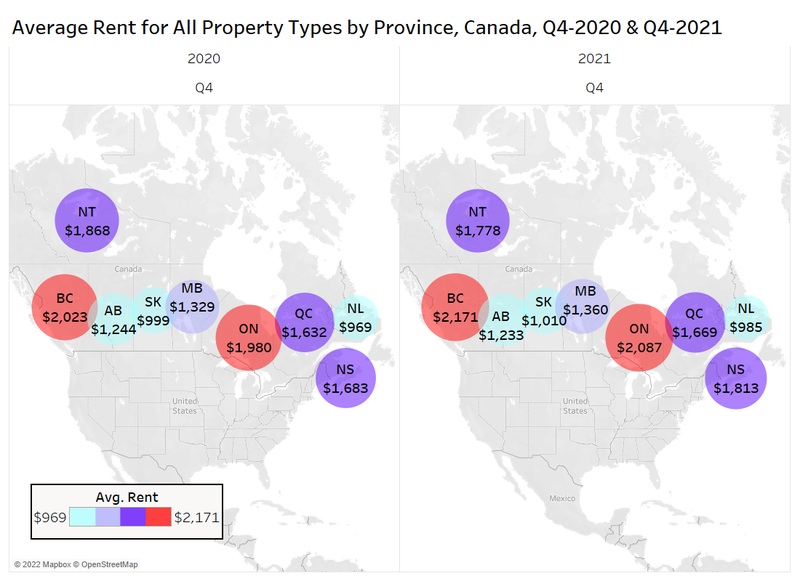
The average rent in Nova Scotia moved from $1,683 per month to $1,813 per month – an annual increase of 7.7%. Anecdotally, it has been reported there has been an influx of Ontario residents moving to Nova Scotia since the pandemic started, driving up rental rates there.
The Northwest Territories experienced an annual decline of 4.8% to $1,778 per month as the only province that experienced any notable annual decreases in average rent, however, the sample size of listings is small. The average rent in Alberta moved from $1,244 per month in Q4-2020 to $1,233 per month in Q4-2021 — an annual decline of less than 1%.
Average Rent for Condo and Rental Apartments in British Columbia, Alberta, Ontario and Quebec
The chart below looks at the average rent in the fourth quarter in 2019, 2020 and 2021 for condo and rental apartments in British Columbia, Alberta, Ontario and Quebec based on listings data from Rentals.ca.
The average rent in Alberta has more or less remained unchanged since 2019, moving from $1,188 per month in 2019, to $1,219 per month in 2020, to $1,199 per month in 2021.
Quebec has seen its average rent move from $1,488 per month in 2019, to $1,623 per month in 2020, to $1,656 per month in 2021. This represents an annual increase of 2% in Q4-2021.
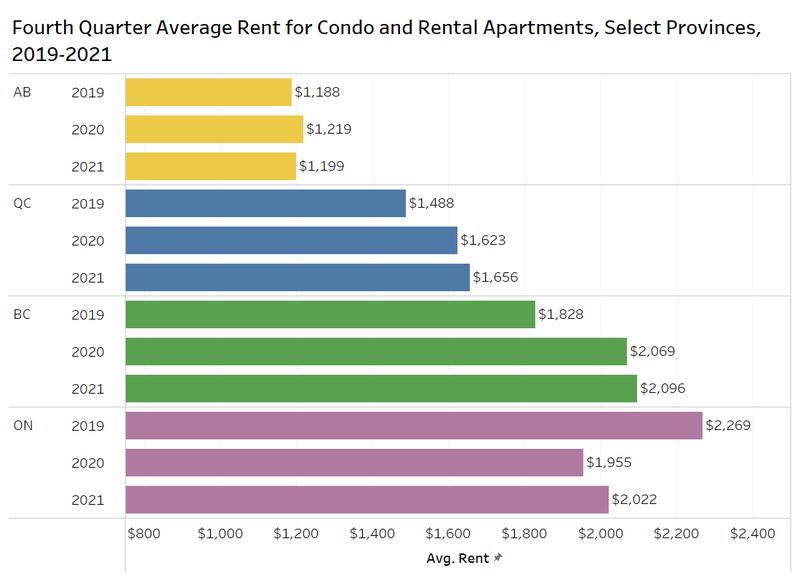
In British Columbia, the average rent for condo and rental apartments moved from $1,828 per month in Q4-2019 to $2,069 per month in Q4-2020, which represented an annual increase of 13%. In Q4-2021, the average rent experienced minimal change, moving from $2,069 per month in Q4-2020 to $2,096 per month in Q4-2021.
In Ontario, the average rent experienced a sharp decline from $2,269 per month in Q4-2019 to $1,955 per month in Q4-2020. This represented an annual decrease of 14%. In relation to the other selected provinces, the average rent in Ontario increased at a higher rate in 2021, moving from $1,955 per month in Q4-2020 to $2,022 per month in Q4-2021 (an annual increase of 3.4%).
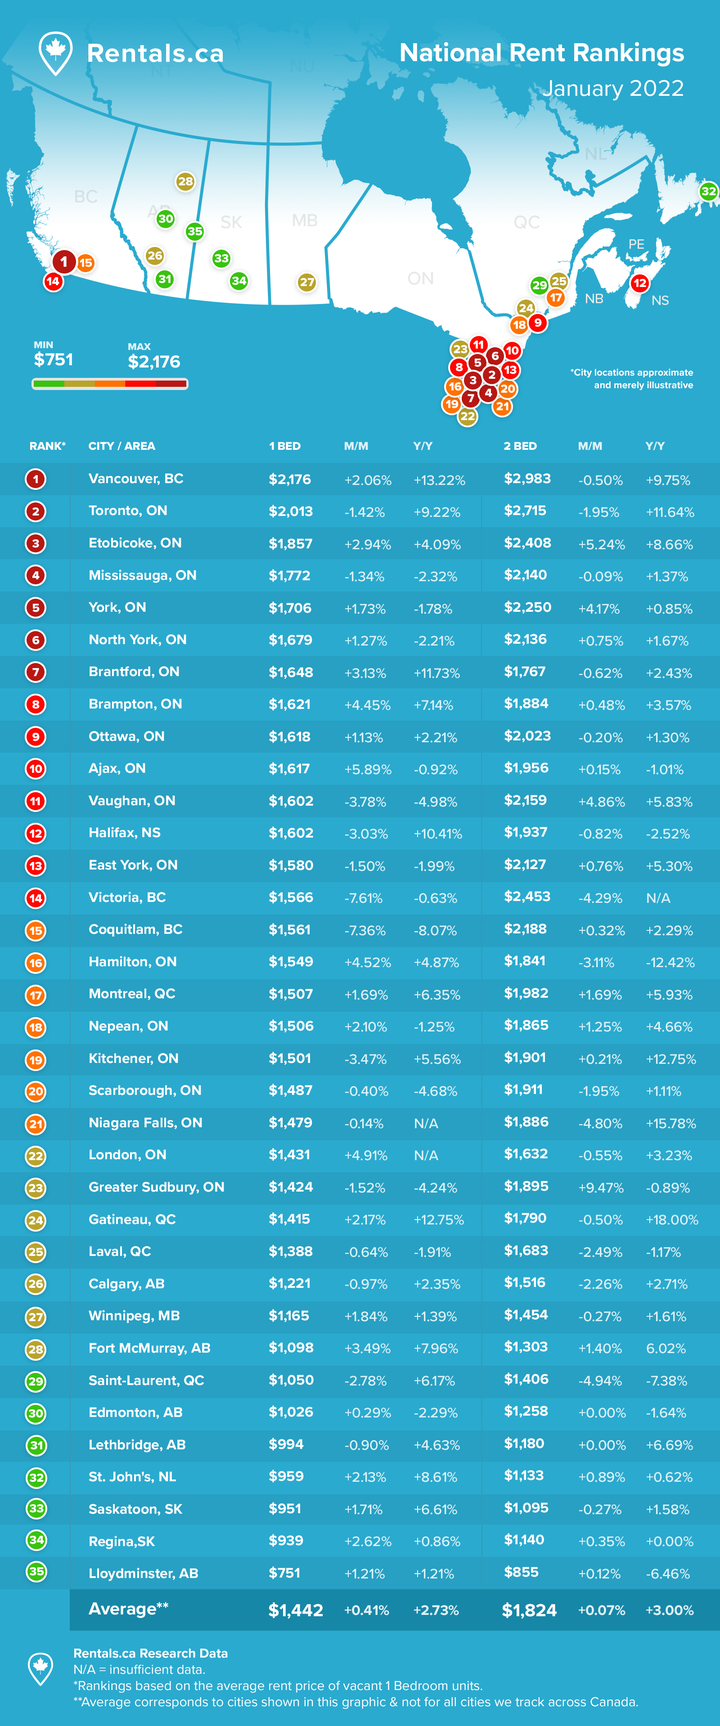
3. Municipal Rental Rates
The chart below looks at the average rent for all property types for December in each of the last four years for select municipalities in Canada (and former municipalities prior to amalgamation in Toronto).
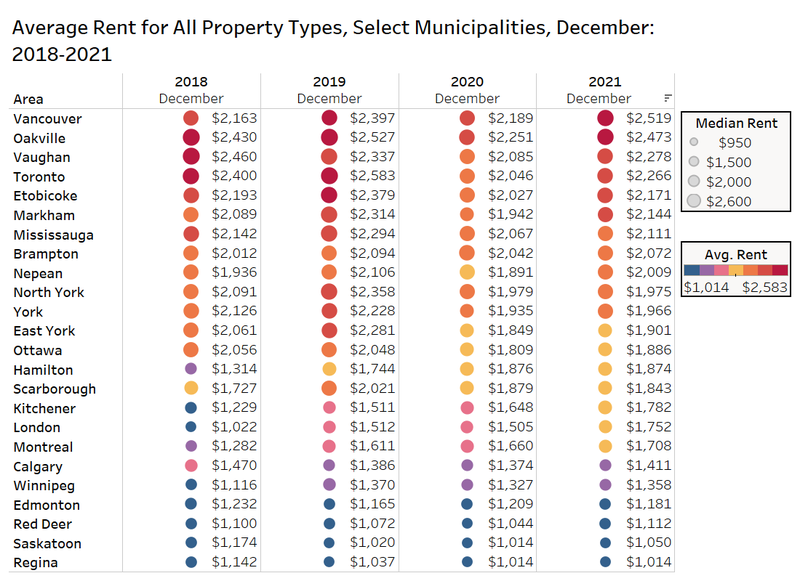
The majority of the selected municipalities experienced an increase in average rent moving from December 2020 to December 2021. North York, Scarborough, Hamilton, and Edmonton were the only municipalities that experienced a decline in average rent (which were minimal).
Vancouver had the highest average rent in December 2021 among these municipalities and former municipalities at $2,519 per month, which is an annual increase of 15% from the December 2020 average of $2,189 per month. Oakville had the next highest average rent at $2,473 per month – an annual increase of 9.9% from its December 2020 average of $2,251 per month. The lowest average rent out of the select municipalities was found in Regina with an average of $1,014 per month, which had remained unchanged since the previous year.
Bullpen Research & Consulting and Rentals.ca’s forecasts from the previous year were fairly close for Calgary, Mississauga, Montreal, and Toronto, with average rents in the select municipalities landing within $150 of the averages forecasted. The average rent in Vancouver was $2,519 per month in December 2021, which was much higher than the predicted average of $2,240 per month.
Condo Rental Market Per-Square-Foot
The chart below looks at the average rent per-square-foot by month from December 2018 to December 2021 in Vancouver, Toronto, Mississauga and Ottawa.
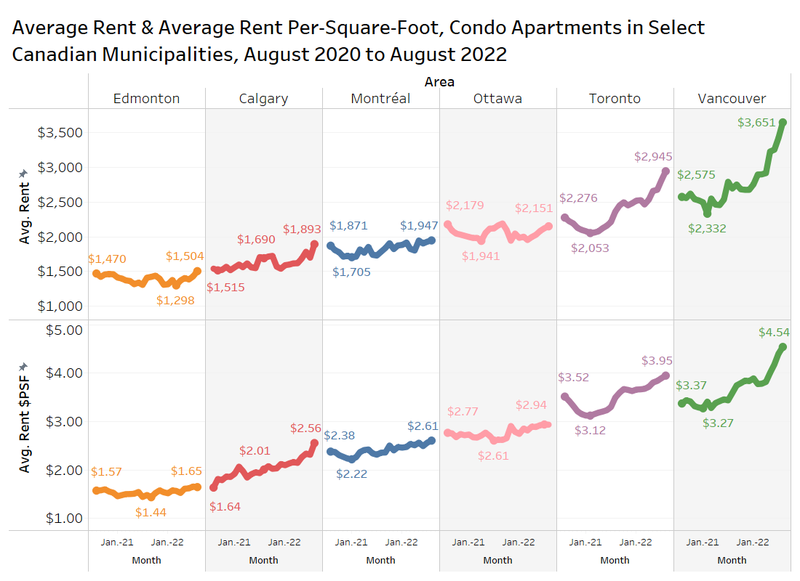
The average rent per-square-foot in Vancouver steadily declined throughout 2020 before sharply recovering to the levels experienced at the start of 2019. The average rent per-square-foot hit a low of $3.29 in the early part of 2021 before rising to $3.84 in December 2021.
The average rent per-square-foot in Toronto followed a similar trend, decreasing throughout 2020 to a low of $3.15 before sharply recovering to $3.63 in December 2021.
The average rent per-square-foot in Mississauga did not experience the same levels of decline as Vancouver and Toronto. The price has bounced off a low of $2.64 per-square-foot and has risen to $2.98 per-square-foot in December 2021, which is a market-high level.
In Ottawa, the average rent per-square-foot has generally remained constant, with no clear trends moving in either direction. The average rent per-square-foot has moved from a low of $2.72 to $2.79 in December 2021.
Average Rent by Postal Code in Toronto
The figure below presents the average rent and annual changes in average rent in Toronto by postal code during the fourth quarter of 2021.
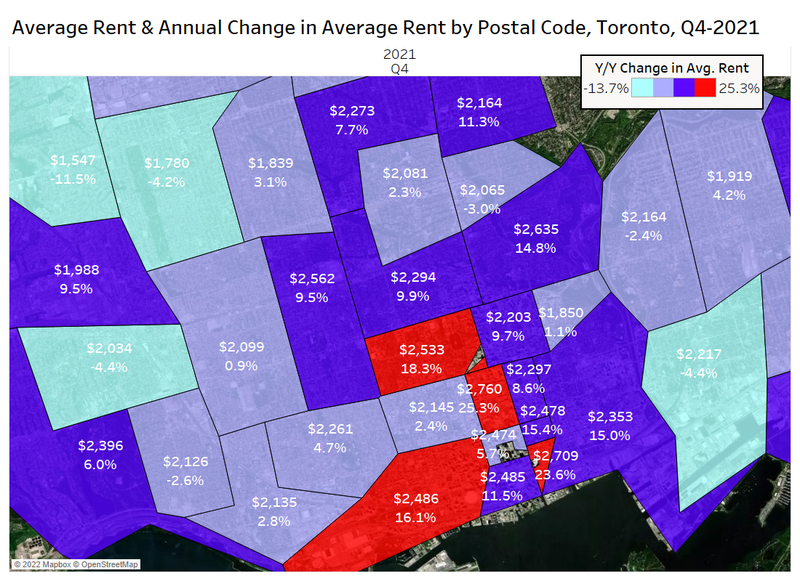
In Toronto, the downtown core experienced the highest levels of annual change in average rent, with annual changes ranging from 2.4% to 25%. The high-volume M5V area saw rents increase by 16% annually to $2,486 per month.
The areas of Toronto slightly farther out of the central core generally experienced middling levels of annual change, with many areas experiencing annual changes in average rent ranging from -4% to +4%.
There was clearly a return to prime real estate in the second half of 2021.
Rental Rates by Area in the GTA
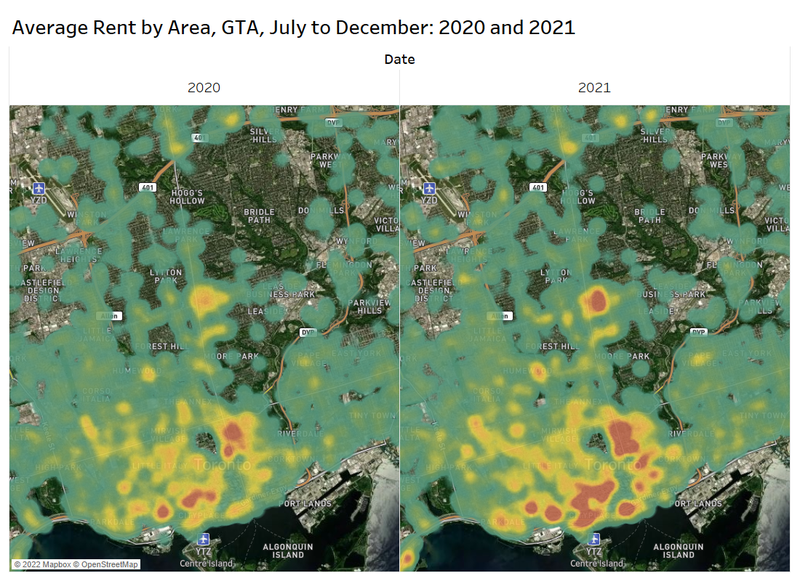
The side-by-side maps below show the average rent by area in the GTA over the final six months of 2020 and the final six months of 2021.
It is clear that the areas with the largest increase in average rent were in the downtown west area, and along Yonge Street near Bloor.
4. Conclusion
Unlike predictions for 2020, the rent forecasts by Bullpen Research & Consulting and Rentals.ca for 2021 were relatively accurate. The forecasts were within $150 of the average rents for the five selected municipalities. The main exception was Vancouver, where the average rent recovered more sharply than predicted.
After a tumultuous 2020 and 2021, the rental market has posted an annual increase in average monthly rental rates for four months in a row, reinforcing the notion that the rental market is recovering from the sharp 2020 declines. This is most clearly demonstrated by the average per-square-foot rents in Vancouver and Toronto, both declining steadily throughout 2020 and most of 2021 before recovering in the latter half of the year.
Although the real estate market had a strong recovery in the last several months, uncertainty will persist as governments issue further lockdown measures because of the Omicron variant of the COVID-19 virus. There is some consensus among experts that these lockdowns and restrictions will be much shorter than previous ones, so the Bullpen Research & Consulting/Rentals.ca forecast of continued rent growth in most major markets in 2022
has not been altered.
Rentals.ca Data
The data used in this analysis is based on monthly listings from Rentals.ca. The data is much different than the more familiar numbers collected and published by Canada Mortgage Housing Corporation (CMHC).
Rentals.ca data includes basement apartments, rental apartments, condominium apartments, townhouses, semi-detached houses and single-detached houses, where CMHC’s primary rental data only includes rental apartments and rental townhouses. CMHC collects some data on the secondary market, but it is reported separately.
The CMHC rental rates are based on the entire universe of purpose-built rental units in Canada (the stock), while Rentals.ca data is primarily based on the asking rents of vacated units only (the flow) — this is a smaller sample size, but more representative of the actual market rent a prospective tenant encounters. The Rentals.ca data set typically produces much higher rental rates in comparison to CMHC, as vacated units are not subject to rent control.
The average and median rental rates via Rentals.ca can also skew higher than CMHC’s data for several reasons: The inclusion of larger and more expensive unit types like singles, row units and condos; the survivorship bias (overpriced units remain in the sample longer); and the multiple listings of the same property at different rent levels every month.
It should also be noted that properties listed for above $5,000 a month and below $500 a month are eliminated from the sample of units analyzed. Also, short-term leases, single-room rentals, and furnished rental units are eliminated from the sample where identifiable.
Rentals.ca is Canada’s premier online marketplace for renters and landlords, providing a comprehensive suite of tools and resources tailored to simplify the rental process. With an extensive selection of listings across the country, Rentals.ca offers user-friendly search functionality that helps renters find their perfect home efficiently. For landlords, Rentals.ca delivers effective advertising solutions to maximize visibility and fill vacancies faster. Committed to innovation and excellence, Rentals.ca aims to empower users with up-to-date market insights and expert guidance, making renting easier and more accessible for everyone.