

National Overview
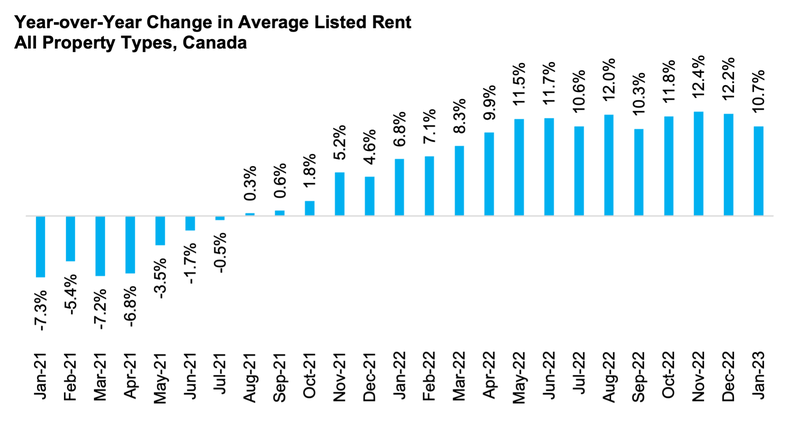
Annual Rent Growth Exceeded 10% for Ninth Straight Month in January
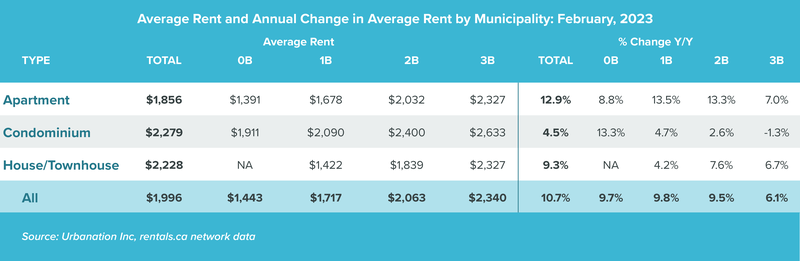
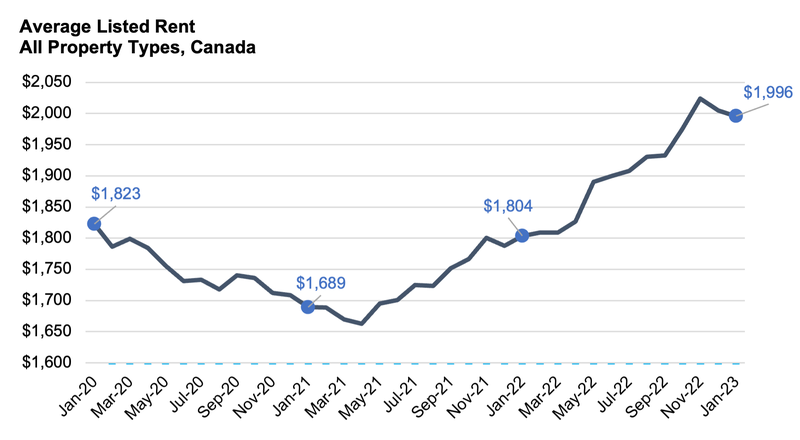
The annual rate of rent inflation in Canada remained in the double-digits for the ninth consecutive month during January, posting a 10.7% increase. The average listed rent for all property types was $1,996 in January, decreasing 0.5% from December after averaging above $2,000 during the previous two months. Compared to the pre-pandemic average rent in January 2020 at $1,823, rents in Canada increased 9.5%, equal to an average annual increase of 3.2% during the three-year period.
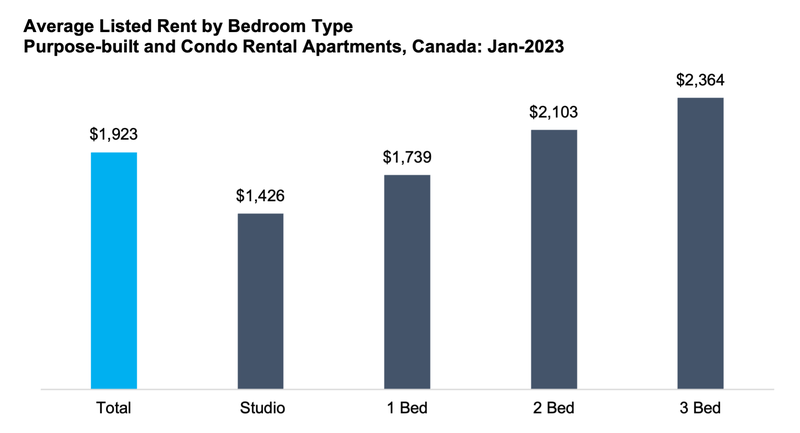
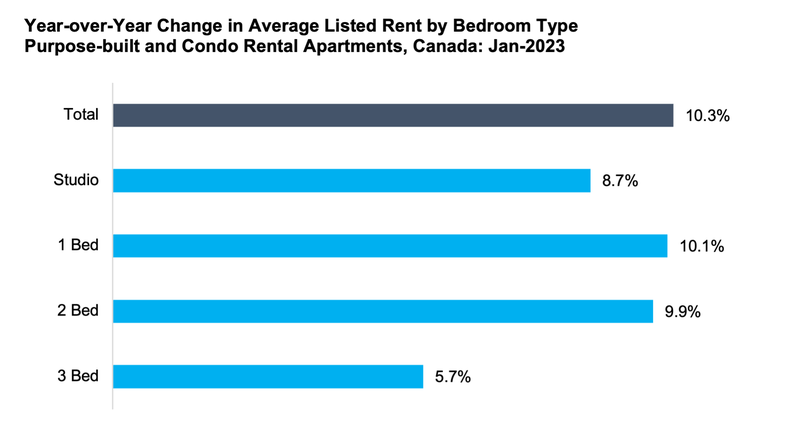
Average rents for purpose-built and condominium apartment rentals continued to move higher in January, increasing 0.6% month over month and 10.3% year over year to $1,923. One-bedroom rents increased the most over the past year, rising 10.1% to an average of $1,739. Two-bedroom rents increased 9.9% annually to an average of $2,103, while studios recorded an 8.7% annual increase to reach an average of $1,426. Three-bedroom rents, which averaged $2,364 in January, rose the slowest over the past year with a 5.7% increase.
Provincial Overview
*Totals are reflective of all available listings and not the data listed within individual tables
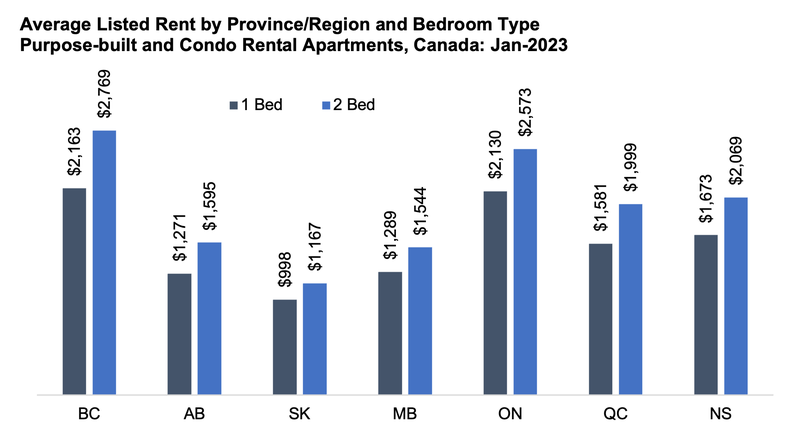
Alberta Leading Rent Growth to Start 2023
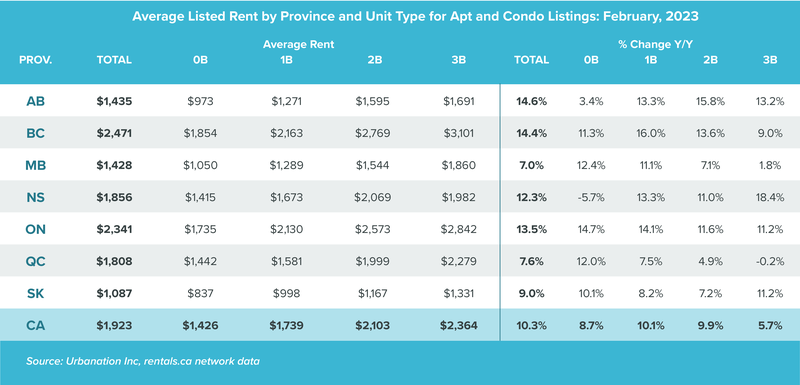
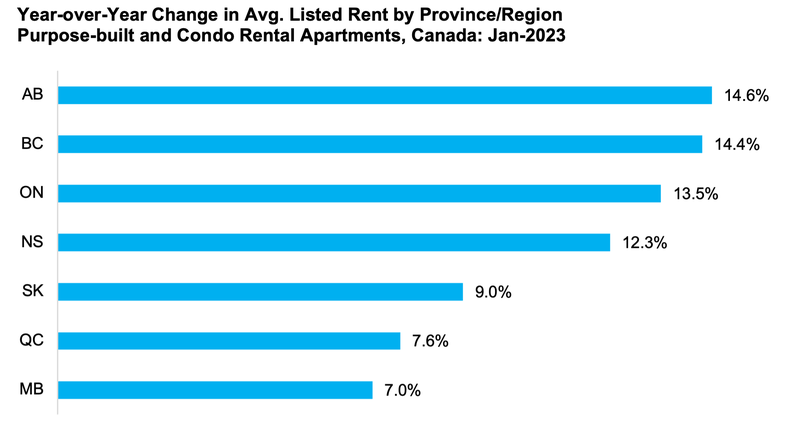
The province of Alberta experienced the highest annual rent increase for apartments in January with 14.6% growth, closely followed by British Columbia with 14.4% growth. Ontario placed third with 13.5% annual rent growth, while Nova Scotia rent inflation was 12.3% in January. All other provinces recorded annual rent growth under 10%.
Despite having the fastest rent growth in January, Alberta’s apartment rents were relatively affordable at an average of $1,435, with one-bedrooms averaging $1,271 and two-bedrooms averaging $1,595. Average rents in British Columbia were 72% higher than in Alberta at $2,471, with one-bedrooms averaging $2,163 and two-bedrooms averaging $2,769. On average, apartment rents in Ontario were 5% cheaper than in British Columbia at $2,341, with one-bedrooms averaging $2,130 and two-bedrooms averaging $2,573. The least expensive province for rental apartments in January was Saskatchewan at an average of $1,087 (9.0% annual increase), with one-bedrooms averaging $998 and two-bedrooms averaging $1,167.
Municipal Rental Rates
*Totals are reflective of all available listings and not the data listed within individual tables
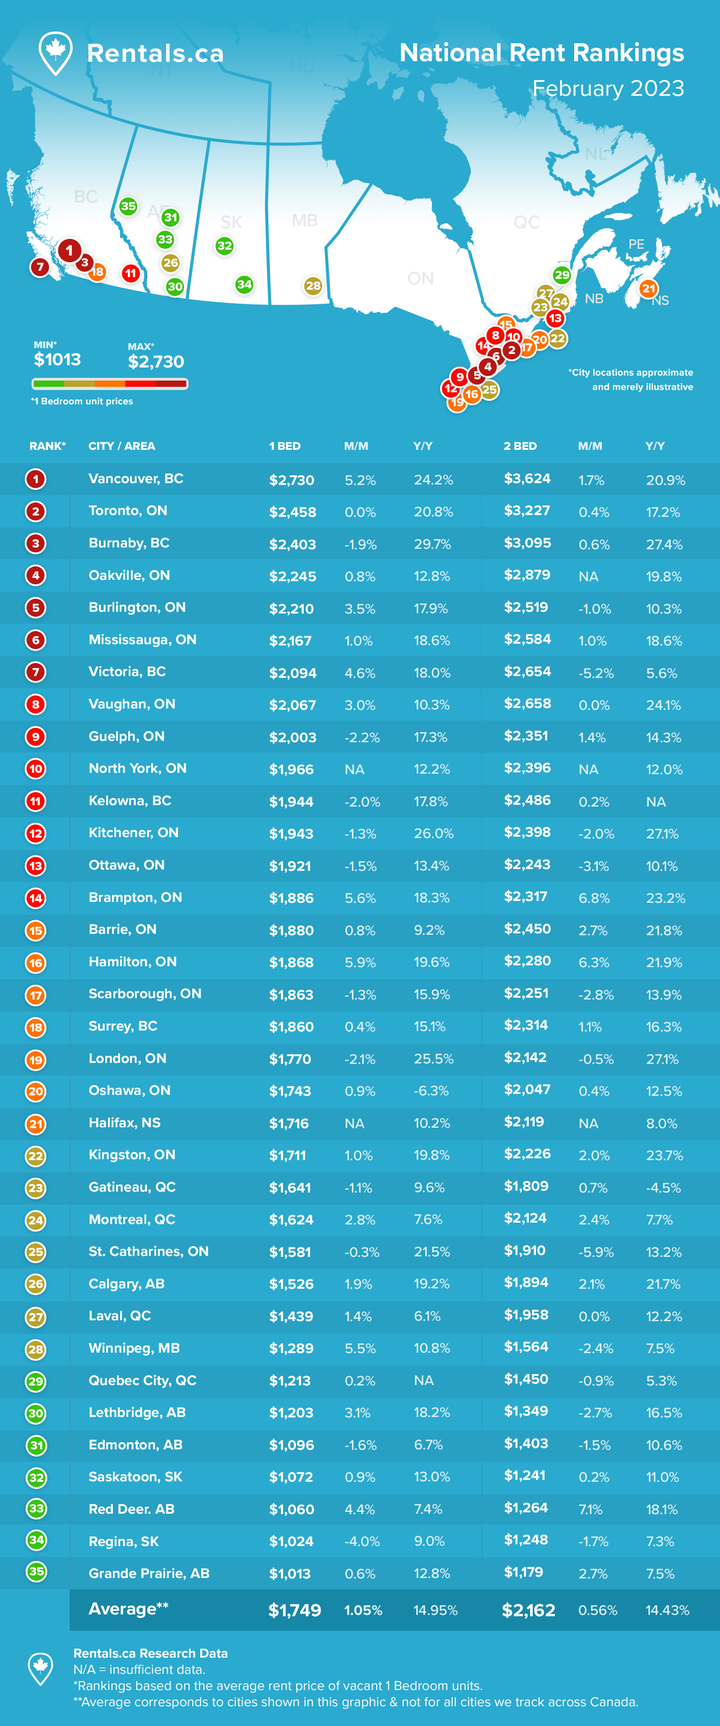
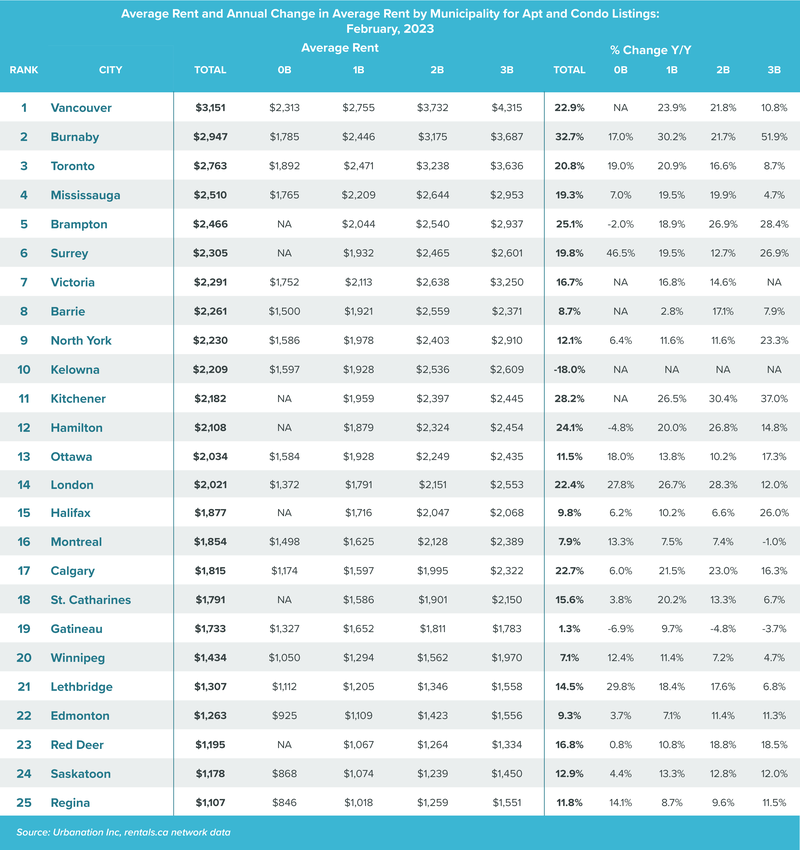
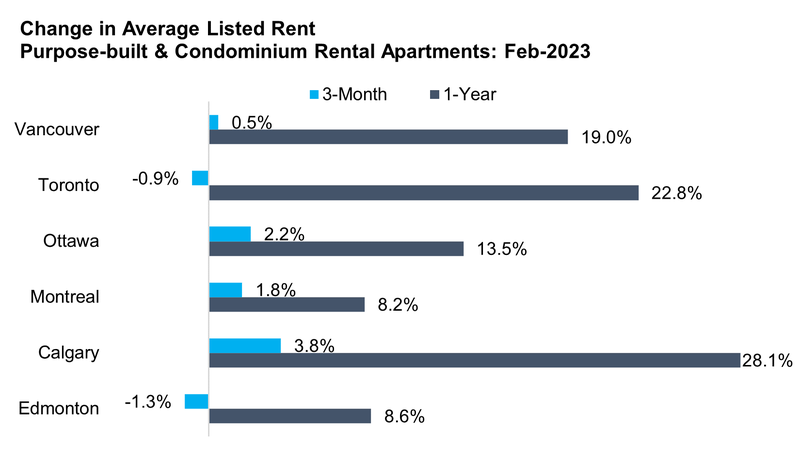
Vancouver and Calgary Rents Increasing Fastest Among Canada’s Largest Cities
Among Canada’s six largest rental markets, Vancouver and Calgary had the highest increases for condominium rentals and apartment rents in January, with annual growth of 22.9% and 22.7%, respectively. Toronto apartment rents increased 20.8% annually in January, while the remaining three largest cities recorded notably lower annual rent growth ranging between 7.9% in Montreal and 11.5% in Ottawa.
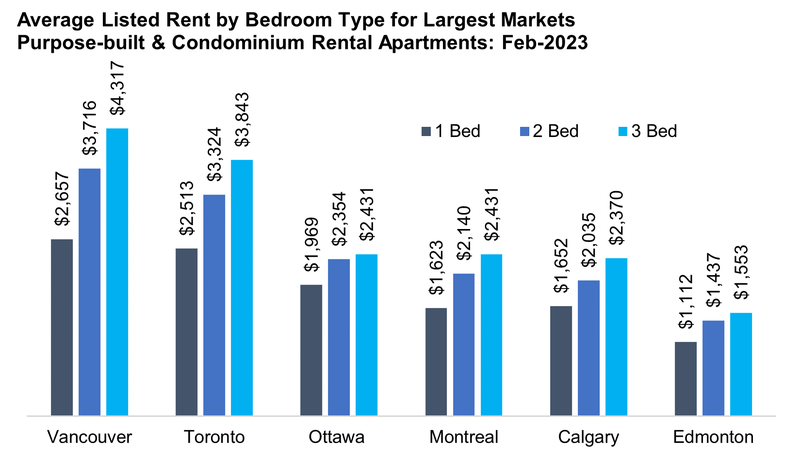
Vancouver maintained its position as Canada’s most expensive rental market, with rents for one-bedroom units averaging $2,755 and two-bedroom rents averaging $3,732. Toronto, the second most expensive market, had average rents of $2,471 for one-bedrooms and $3,238 for two-bedrooms in January.
Rents were significantly cheaper in Ottawa and Montreal, where one-bedroom apartments averaged $1,928 and $1,625, respectively, and $2,249 and $2,128 for two-bedrooms respectively. As Calgary apartment rents soared over the past year to an average of $1,597 for one-bedroom homes and $1,995 for two-bedrooms in January, Edmonton rents were comparatively cheaper at $1,109 for one-bedrooms and $1,423 for two-bedrooms.
British Columbia Cities Top List of Most Expensive Medium-sized Rental Markets
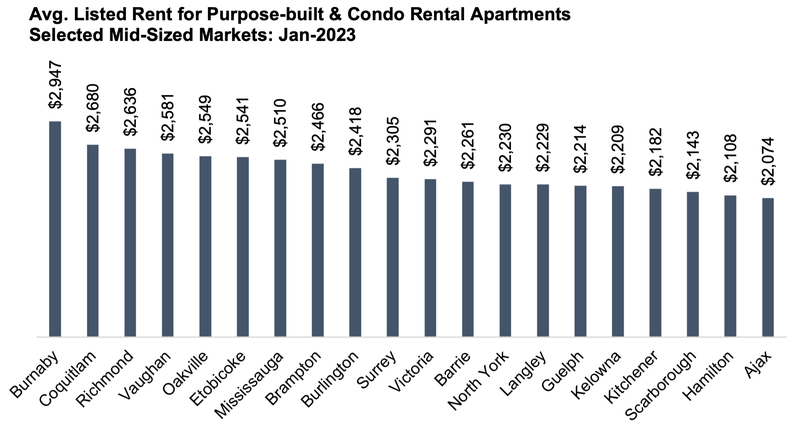
Among medium-sized markets, the three most expensive cities for average rents in January were all in British Columbia, led by Burnaby ($2,947), Coquitlam ($2,680), and Richmond ($2,636). The next six most expensive medium-sized rental markets were all in the Greater Toronto Area: Vaughan ($2,581), Oakville ($2,549), Etobicoke ($2,541), Mississauga ($2,510), Brampton ($2,466), and Burlington ($2,418). All of the top 20 most expensive medium-sized rental markets were in either British Columbia or Ontario.
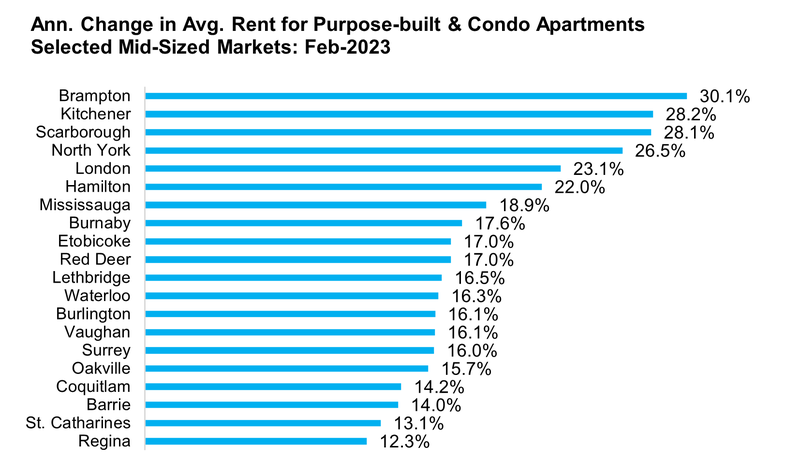
Burnaby took over the top spot for the fastest appreciating rental market in January, posting a 32.7% year-over-year increase. This was followed by last month’s fastest growing market of Kitchener, with rents increasing by 28.2% compared to a year ago. Brampton and Hamilton moved up to third and fourth for annual rent growth with increases of 25.1% and 24.1%, respectively. London rounded out the top five for fastest rent growth among medium-sized markets with a 22.4% increase. New entrants into the top 20 for rent inflation during January included Red Deer (16.8%), Grande Prairie (15.8%), Vaughan (14.6%), Oakville (14.4%), and Coquitlam (14.4%).
Rentals.ca Data
The data used in this analysis is based on monthly listings from the Rentals.ca Network of Internet Listings Services (ILS). This data differs from the numbers collected and published by the Canada Mortgage Housing Corporation (CMHC).
The Rentals.ca Network of ILS’s data covers both the primary and secondary rental markets and includes basement apartments, rental apartments, condominium apartments, townhouses, semi-detached houses, and single-detached houses. CMHC’s primary rental data only includes purpose-built rental apartments and rental townhouses. CMHC also collects data on secondary market rentals, but this is reported separately.
CMHC’s rental rates are based on the entire universe of purpose-built rental units (rental stock), regardless of rental tenure. CMHC rental rates are reflective of what the average household spends on rental housing and not the current market rents for vacant units. The data used in this report is based on the asking rates of available (vacant) units only and reflect on-going trends in the market. This covers a smaller sample size but is more representative of the actual market rent a prospective tenant would encounter. The Rentals.ca Network of ILS’s data typically provides much higher rental rates compared to CMHC, as vacant units typically reset to market rates when not subject to rent control.
The average and median rental rates in this report can also skew higher than CMHC’s data for the following reasons: the inclusion of larger more expensive unit types such as single-family homes, townhouse units, and large luxury condominium units; the presence of duplicate or multiple listings at the same property and the survivorship bias where more expensive or over-priced units take longer to lease and remain in the sample longer.
Properties listed for greater than $5,000 per month, and less than $500 per month are removed from the sample. Similarly, short-term rentals, single-room rentals, and furnished suites are removed from the sample when identifiable.
Urbanation is a real estate research firm providing market research.
Urbanation provides in-depth market analysis and consulting services to the apartment industry since 1981. Urbanation uses a multi-disciplinary approach that combines empirical research techniques, industry relationships forged over the past four decades, and first-hand observations and site visitations. Urbanation offers subscription services and custom market feasibility studies covering the new construction condominium and purpose-built rental apartment markets in Ontario.