

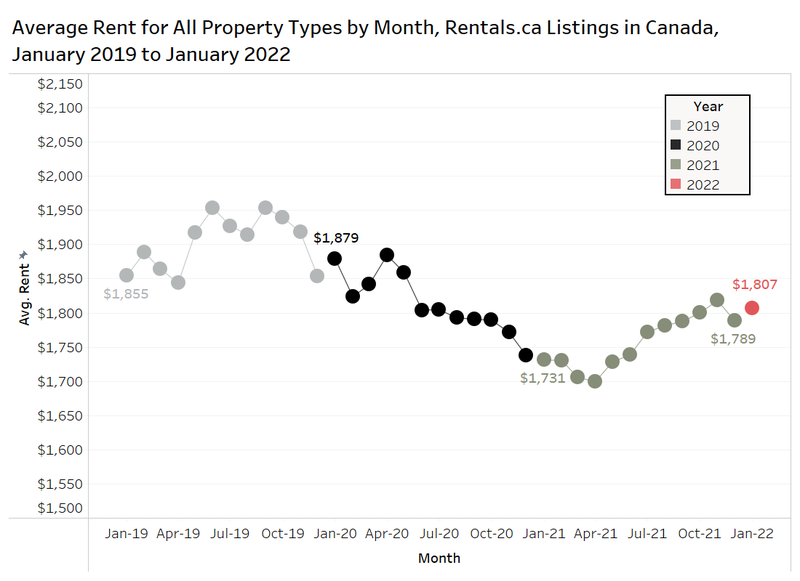
The average rent for all Canadian properties listed on Rentals.ca in January was $1,807 per month, up 4.4% annually and 1.0% monthly. The average rental rate in January of this year remains below the $1,879 per month average in January 2020 and the $1,855 per month average in January 2019.
Rentals.ca February 2022 Rent Report
Rentals.ca February 2022 Rent Report
1. National Overview
This report tracks single-family, townhouse, condominium apartment, rental apartments and basement apartment listings. The rental market on a national basis peaked in late 2019, trended down through most of the early pandemic period of April 2020 to April 2021, and has generally trended up since that time. The December 2021 monthly rent decline is a typical seasonal change, as seen in both 2020 and 2019.
Rental Rates by Property Type
Compositional changes in the sample of listings analyzed in this report can impact the rental rates, and controlling for the unit type can help in determining rent movements in the market.
The chart below shows the average monthly rental rates, as well as the average rental rate per-square-foot for single-family homes, condominium apartments, and rental apartments for the January 2021 to January 2022 period. The colours of the markers represent the median rent.
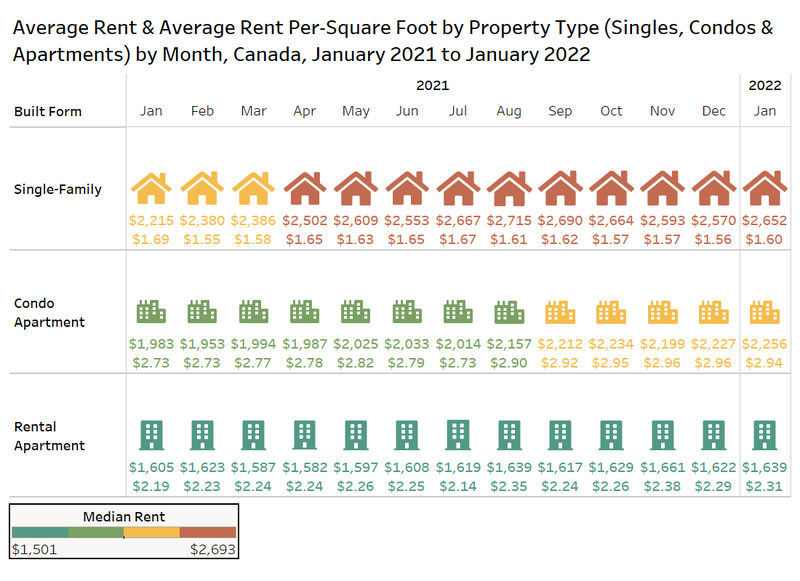
The average rental rate for a single-family home in January 2022 was $2,652, up 3.2% monthly from December’s average rent of $2,570, and nearly 20% above last January’s average of $2,215.
Condominium apartments in January 2022 moved from $2,227 per month in December 2021 to $2,256 per month in January 2022, a month-over-month increase of 1.3%. On an annual basis, condo rents increased by 13.8%.
The average rental rates for rental apartments increased month over month by 1.0% from $1,622 in December 2021 to $1,639 per month in January 2022. When comparing to January 2021, average rents for apartments have increased by 2.1%
Average Rent by Bedroom Type
The chart below looks at the average rent and average rent per-square-foot for one- to three-bedroom units based on all property types in Canada via Rentals.ca listings data.
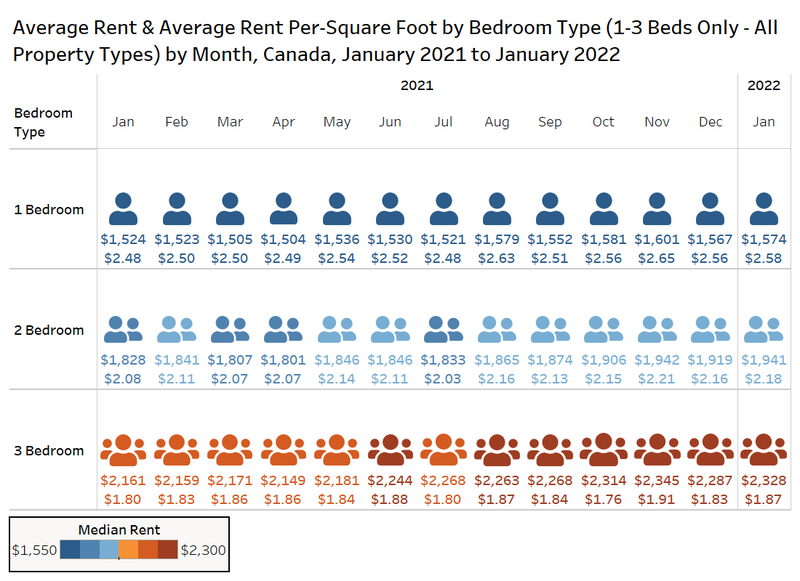
Average rent has increased for one, two, and three bedrooms both month over month and year over year.
One-bedroom units have moved from $1,567 in December 2021 to $1,574 in January 2022, a monthly increase of 0.4%. One-bedroom units have also increased 3.3% annually from $1,524 in January 2021 (4.0% increase in per-foot rents).
Two-bedroom units have moved from $1,919 in December 2021 to $1,941 in January 2022, a monthly increase of 1.1%. Two-bedroom units have also increased 6.2% annually from $1,828 in January 2021 (4.8% annual increase in per-square-foot rents).
Three-bedroom units have moved from $2,287 in December 2021 to $2,328 in January 2022, a monthly increase of 1.8%. Three-bedroom units have also increased 7.7% annually from $2,161 in January 2021 (3.9% annual jump based on per-foot rents).
On an absolute basis, rents for larger units are appreciating faster, but when you control for the unit sizes, all of the bedroom types are increasing at a similar rate of 4% to 5% year over year.
2. Provincial Rental Rates
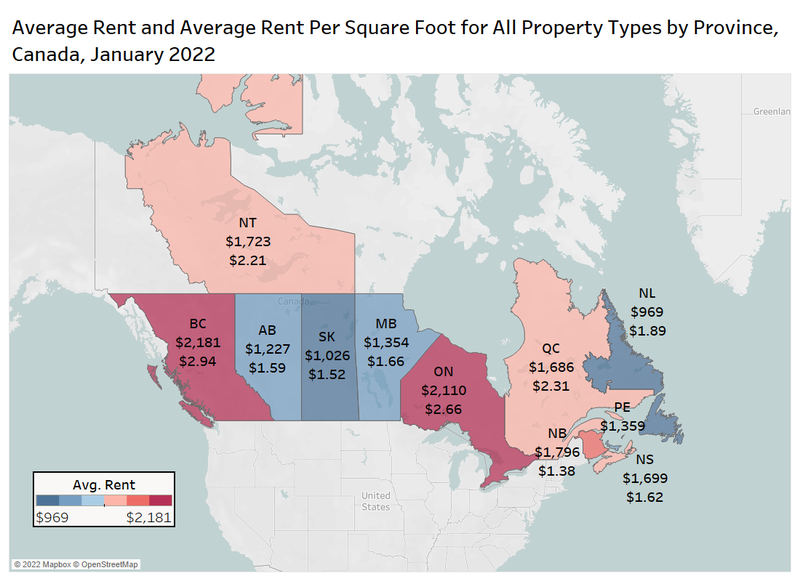
The chart below presents data on the average rent and average rent per square foot for all property types by province via Rentals.ca listings.
British Columbia, Ontario and New Brunswick had the highest average rent at $2,181, $2,110, and $1,796 respectively. Newfoundland and Saskatchewan had the lowest average rental rates at $969 and $1,026 per month.
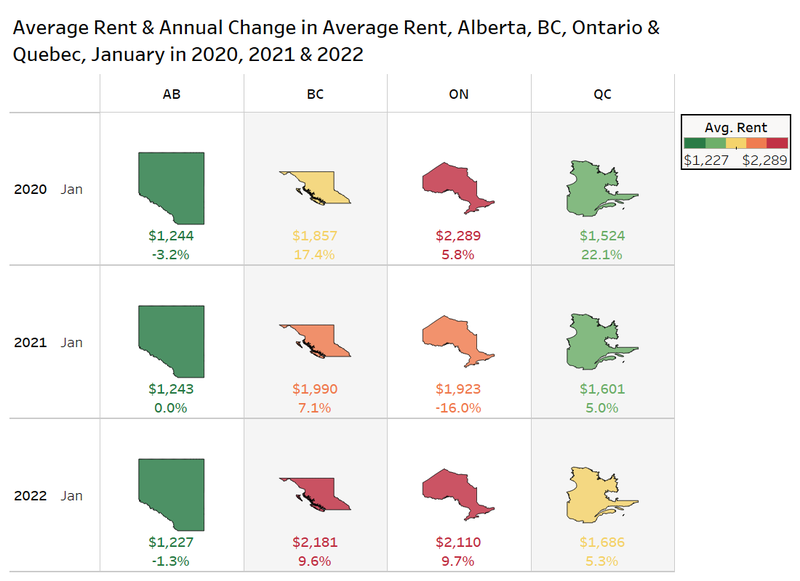
The chart below looks at average rent for all property types in Alberta, British Columbia, Ontario and Quebec in January 2020, January 2021 and January 2022. The annual change in average rent is also shown.
Alberta had an average rent of $1,227 per month, showing an annual decline of 1.3%; this compares to a 0.0% change in January 2021 and a 3.2% decline in January 2021.
British Columbia had an average rent of $2,181 per month, showing an annual increase of 9.6%, which is just below Ontario’s increase of 9.7% annually to $2,110 per month.
Lastly, Quebec had an average rent of $1,686 per month in January 2022, an annual increase of 5.3%. The increase was 5.0% a year earlier, following huge growth in January 2020 of over 22% annually.
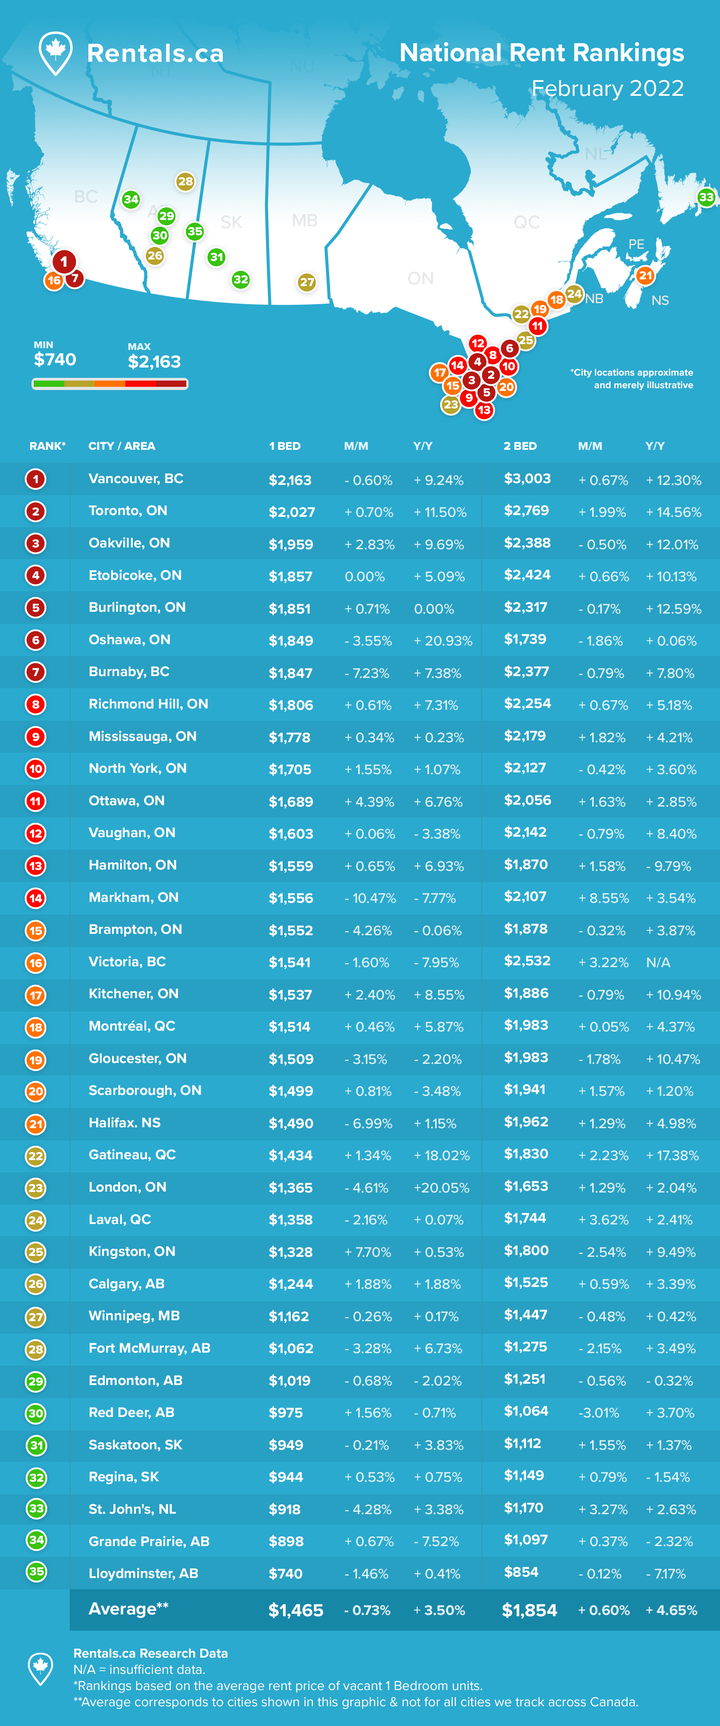
3. Municipal Rental Rates
Annual Change in Rent for Top Municipalities in Canada
This next chart shows the average rent and annual change in average rent for all property types across several municipalities (and former municipalities in Toronto pre-amalgamation) in Canada in January 2022.
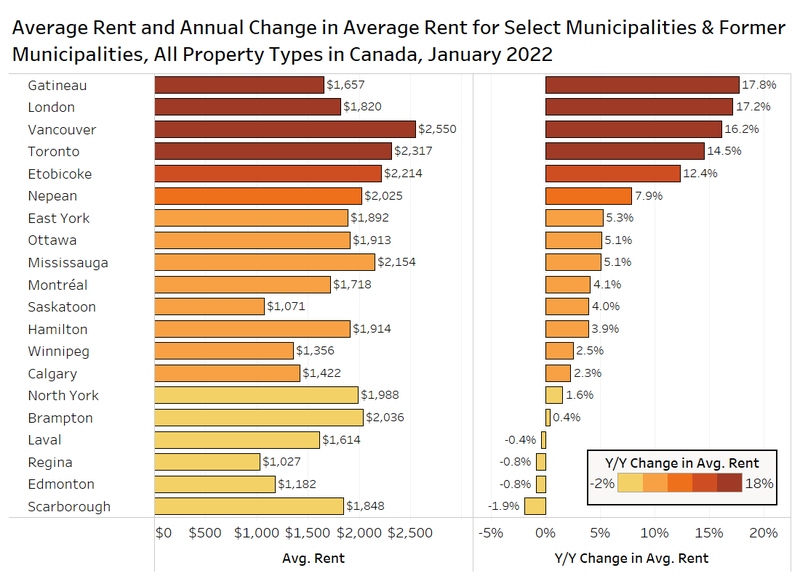
Vancouver has the most expensive rents in the country at $2,550 per month, an annual increase of 16.2% year over year. Toronto was the next most expensive city at $2,317 per month, experiencing an annual increase of 14.5%.
Gatineau and London are the municipalities that experienced the largest annual increases in average rent. Gatineau increased 17.8% to $1,657 per month, while London increased 17.2% to $1,820 per month.
Only a handful of municipalities experienced annual decline in average rent. Scarborough experienced the largest annual decline, decreasing 1.9% to $1,848 per month.
Average Rent by Property Type in Vancouver, Toronto and Montreal
The chart below looks at the average rent by property type in Vancouver, Toronto (pre-amalgamation boundaries), and Montreal in 2020 and 2021 overall, and in January 2022.
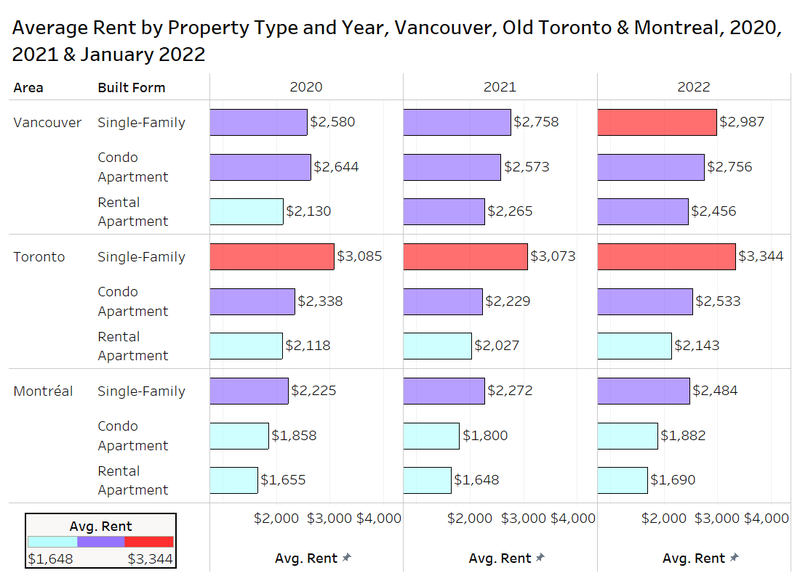
In Vancouver, single-family homes have seen their average rental rate move from $2,758 per month in 2021 to $2,987 per month in January 2022, which is 8.3% higher than last year’s total. Condo apartments have moved from $2,573 per month in 2021 to $2,756 per month in January 2022 (+7.1%). Rental apartments have moved from $2,265 per month in 2021 to $2,456 per month in January 2022 (+8.4%).
In Toronto, single family homes have moved from $3,073 per month in 2021 to $3,344 per month in January 2022 (+8.8%). Condo apartments have moved from $2,229 in 2021 to $2,533 in January 2022 (+13.6%). Rental apartments have moved from $2,027 per month in 2021 to $2,143 per month in January 2022 (+5.7%).
In Montreal, single-family homes have moved from $2,272 per month in 2021 to $2,484 per month in January 2022 (+9.3%). The average rent for condo apartments has moved from $1,800 per month in 2021 to $1,882 per month in January 2022 (+4.6%). Rental apartments have moved from $1,648 per month in 2021 to $1,690 per month in January 2022 (+2.5%).
Average Rent by Bedroom Type in Ottawa, Calgary, Winnipeg, Edmonton and Saskatoon
The chart below looks at the average rent by bedroom type in 2020 and 2021 overall, as well as January 2022 in five municipalities in Canada.
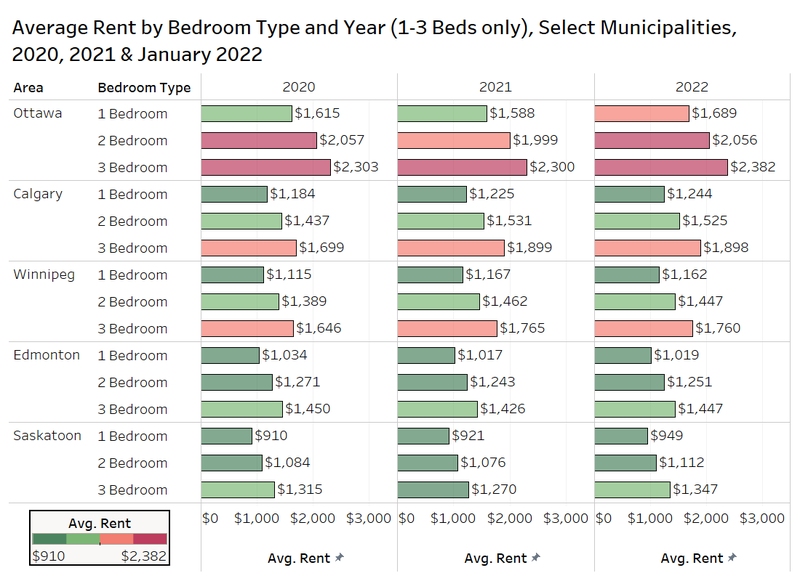
January 2022 average rents in Ottawa are up compared to 2021 overall. One-bedroom units have moved from $1,588 per month in 2021 to $1,689 per month in January 2022. Two-bedroom units have increased from $1,999 per month in 2021 to $2,056 per month in January 2022. Three-bedroom units in Ottawa have increased from $2,300 per month in 2021 to $2,382 per month in January 2022.
Several of the markets above have shown little rent growth, with unit types in the select municipalities generally close to their 2021 overall rent levels.
GTA Condo Rental Market
In January 2022, the average rent per-square-foot for a condominium apartment in Downtown Toronto was $3.70. Since January 2021, the average rent per-square-foot has gradually moved up, increasing annually by 19%. This follows an unprecedented single-year decline of 21% January 2020 to January 2021.
The downtown market remains well below the rent levels from two years ago, with current rents about 6% below previous peak levels.
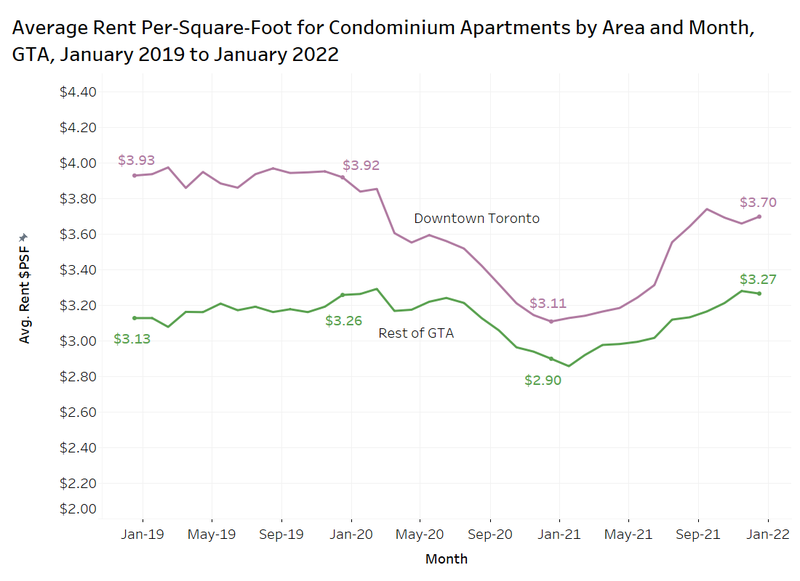
The rest of the GTA followed a similar pattern as Downtown Toronto, with the average rent per-square-foot steadily increasing throughout 2021 moving from $2.90 per square foot in January 2021 to $3.27 per square foot in January 2022 — an annual increase of 12.8%. Rents outside the downtown core have now returned to pre-pandemic levels.
In January 2021, the average rent per-square-foot in Downtown Toronto was 7% higher than the average rent per-square-foot in the rest of the GTA. In January 2022, this has since increased to 13%. By comparison the gap in January 2019 was almost twice that rate at nearly 26%.
4. Conclusion
After the typical seasonal decline in December, average rental rates in Canada have started to trend up again. The fear that the Omicron variant would derail the economy and lockdown the country again has subsided, with tenants again out looking for a place to rent.
Many municipalities across Canada are experiencing substantial annual increases in average rent, which must be viewed in light of the fact that average rents fell off a cliff during the worst of the pre-vaccine pandemic, so comparisons this year will skew high.
The largest growth continues to be for single-family rentals, as many potential buyers choose to rent, fearing the ownership market has gotten too frothy. Potential government intervention in the ownership market and future interest rates hikes play into their decisions to rent. The second reason single-family rentals are rising is an increase in investor activity in a more upscale single-family product, which necessitates higher rents.
In Toronto, the downtown core was hit the hardest by the pandemic as the average per-square-foot rents declined at a quicker rate than the rest of the GTA. This premium has begun to widen again, with the average per-square-foot rents in Downtown Toronto increasing at a quicker rate than the rest of the GTA. Bullpen Research & Consulting expects this trend to continue moving forward, as tenants begin slowly returning to the office.
Check this link every month for an updated report on the state of the rental market in Canada.
Rentals.ca Data
The data used in this analysis is based on monthly listings from Rentals.ca. The data is much different than the more familiar numbers collected and published by Canada Mortgage Housing Corporation (CMHC).
Rentals.ca data includes basement apartments, rental apartments, condominium apartments, townhouses, semi-detached houses and single-detached houses, where CMHC’s primary rental data only includes rental apartments and rental townhouses. CMHC collects some data on the secondary market, but it is reported separately.
The CMHC rental rates are based on the entire universe of purpose-built rental units in Canada (the stock), while Rentals.ca data is primarily based on the asking rents of vacated units only (the flow) — this is a smaller sample size, but more representative of the actual market rent a prospective tenant encounters. The Rentals.ca data set typically produces much higher rental rates in comparison to CMHC, as vacated units are not subject to rent control.
The average and median rental rates via Rentals.ca can also skew higher than CMHC’s data for several reasons: The inclusion of larger and more expensive unit types like singles, row units and condos; the survivorship bias (overpriced units remain in the sample longer); and the multiple listings of the same property at different rent levels every month.
It should also be noted that properties listed for above $5,000 a month and below $500 a month are eliminated from the sample of units analyzed. Also, short-term leases, single-room rentals, and furnished rental units are eliminated from the sample where identifiable.

Rentals.ca is Canada’s premier online marketplace for renters and landlords, providing a comprehensive suite of tools and resources tailored to simplify the rental process. With an extensive selection of listings across the country, Rentals.ca offers user-friendly search functionality that helps renters find their perfect home efficiently. For landlords, Rentals.ca delivers effective advertising solutions to maximize visibility and fill vacancies faster. Committed to innovation and excellence, Rentals.ca aims to empower users with up-to-date market insights and expert guidance, making renting easier and more accessible for everyone.