

The average rent for all Canadian properties listed on Rentals.ca in November was $1,743 per month, down 9.1% annually and 2.2% from October 2020.
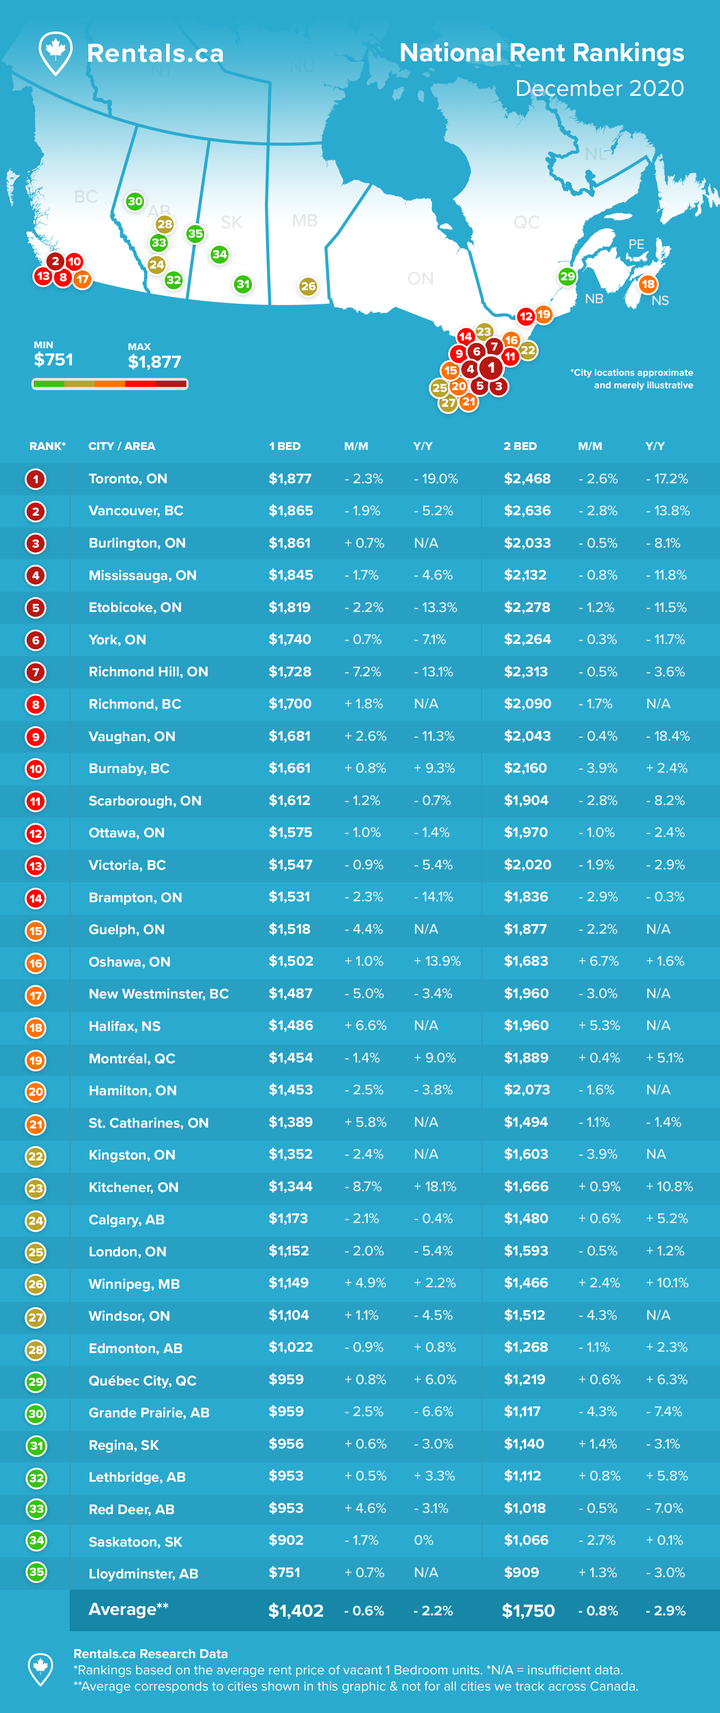
Rentals.ca December 2020 Rent Report
Rentals.ca December 2020 Rent Report
1. National Overview
The chart below shows the average monthly asking rent for single-family housing, townhouses, rental apartments, condominium apartments, and basement apartments cumulatively from November 2019 to November 2020 of this year (top panel), with the annual change in rent shown in the bottom panel.
The rental market in Canada has done a 180-degree turn from extremely hot to extremely cold, with November 2019’s average rent of $1,918 per month up 9.4% annually, compared to this year’s decline of 9.1%.
Rental Rates by Property Type
The chart below looks at the average (area) and median (line) rent by property type in Canada via Rentals.ca listings. The maximum and minimum average rent level over the past two years is shown in the top panel. Single-family homes, which consists of single-detached and semi-detached properties, have clearly trended down since mid- to late-2019.
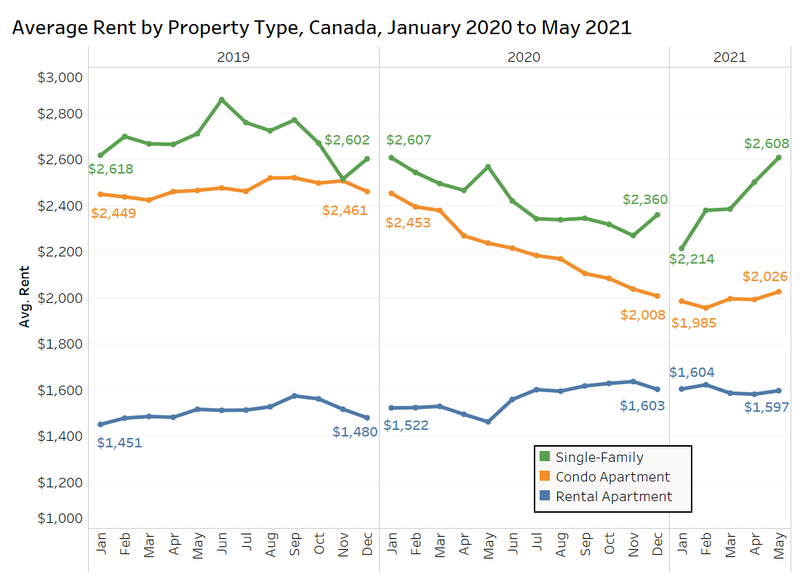 Single-family housing for rent is down 10% annually, falling from $2,514 per month last November to $2,271 per month this November. Average rents are also down 1% from November 2018 (see bottom panel in the chart above).
Townhouse rents are down 3% annually, but are still up 5% from November 2018.
Condominium apartments have experienced the biggest drop this year, falling 19% annually to $2,038 per month from $2,508 per month in November 2019. The average rent is also down 17% from November 2018.
Surprisingly, the average rent for rental apartments is up 7% annually in November to $1,621 per month, $100 more than November 2019. Rent has increased 15% from November 2018. It is worth noting that these are asking rents, and some landlords are negotiating discounts, and for more expensive properties, they are offering one or two months free rent. Secondly, there have been a number of new apartment completions, and increased vacancies in new properties completed over the past couple of years, contributing to the rise.
Annual Change in Average Rent for Condo & Rental Apartments by Bedroom Type
The chart below looks at the stark difference in rent changes for condominium apartments versus rental apartments on a national basis.
Condos for lease by private landlords saw average rents increase slightly year over year in November 2019, with one-bedrooms up 1% and two-bedrooms up 3%. In 2020, the market has experienced an unprecedented one-year decline, with one-bedrooms down 19% annually and two-bedroom units down 18% annually.
This report has commented on many of the factors, which is primarily driven by the downtown markets in Toronto and Vancouver, which have been affected by a lack of immigration, fewer students renting, and fewer new graduates renting their first properties — so demand is way down. Secondly, supply is way up, with former short-term rentals now being offered in the long-term rental market, and new unit completions rising. Based on data from the Canada Mortgage and Housing Corporation, 2020 will likely set a 30-year high for new apartment completions (condo + rental) of about 100,000 suites.
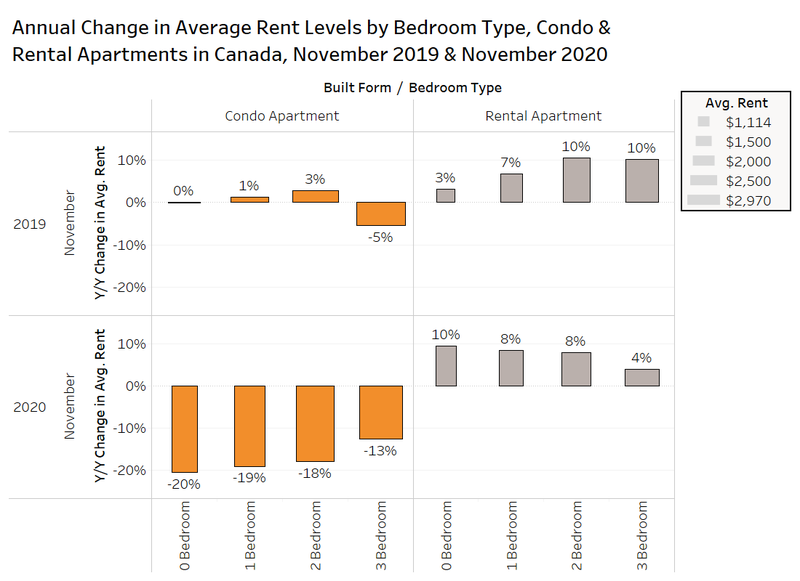 The average rent for one- and two-bedroom apartments increased by 7% and 10% respectively on an annual basis in November 2019, and both bedroom types grew by another 8% in 2020. However, as mentioned above, the composition of units is changing, and a look at the rental rates of individual buildings in Canada can help eliminate some of the ‘noise’ in the sample.
Average Rent by Apartment Project
The next chart looks at rental apartments in Canada with 20 or more listings on Rentals.ca in both 2019 and 2020. The average rent, and annual change in average rent is shown. It must also be reiterated, that a decline in average rent does not necessarily mean that the landlord lowered rent on any individual apartment floor plan or unit type, as the sample may change with more units on lower floors, more units available that have not been renovated, and more smaller units, etc.
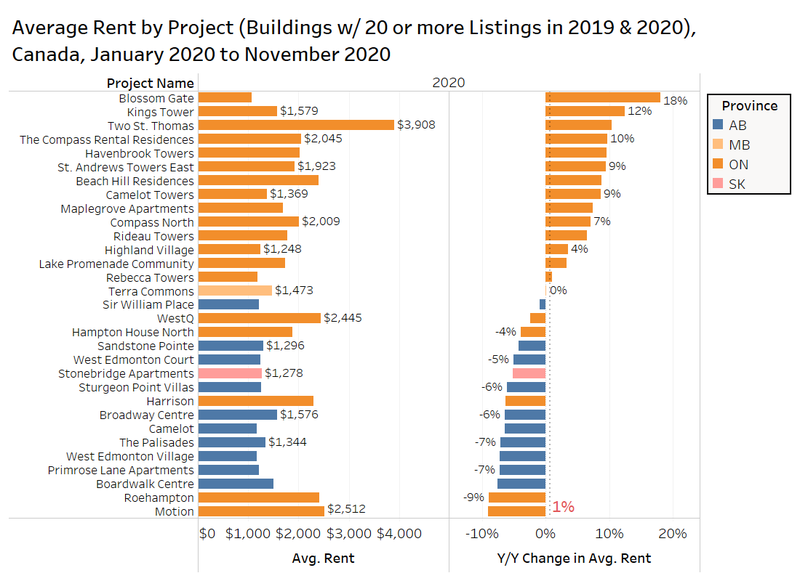 When looking at these projects in 2019, rent was up by over 5% annually, while in 2020, the average rent is up by about 1% annually. When controlling for the location and building age/finish, rents are pretty flat year over year.
2. Provincial Rental Rates
The average rent in Ontario over the past six months on Rentals.ca has been $2,038 per month for all property types, this is a decline of 12% annually. However, the average size of the listings declined by 14% from 981 square feet to 847 square feet, as larger properties are snapped up by the work-from-home crowd, and the small downtown condos sit on the market.
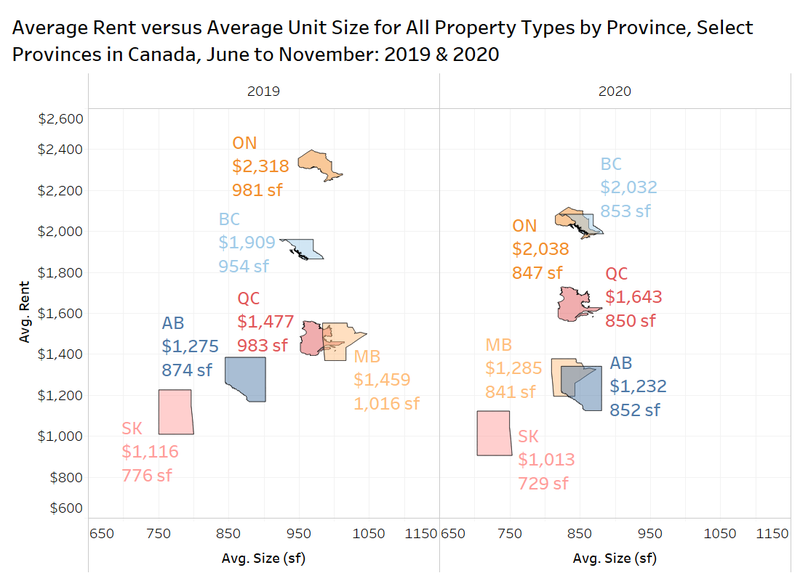 In British Columbia, where the average rent was just shy of Ontario at $2,032 per month, rent increased by 6% annually despite a similar shrinking of the average unit size.
The same phenomenon occurred in Quebec, with the average unit size declining from 983 square feet during the June-November 2019 period to 850 square feet over the same period in 2020. The average rent in Quebec is up 11% annually, as the COVID-19 slump has not impacted that province.
The average unit size didn’t shrink nearly as much in Alberta as the previous three provinces, but rent declined year over year from $1,275 in 2019 to $1,232 per month on average in 2020, a rent correction of 3% annually.
3. Municipal Rental Rates
The chart below looks at five municipalities in Canada, showing the average rent and average rent per square foot (psf) in November 2019 and November 2020, plus the annual change in average rent in those months.
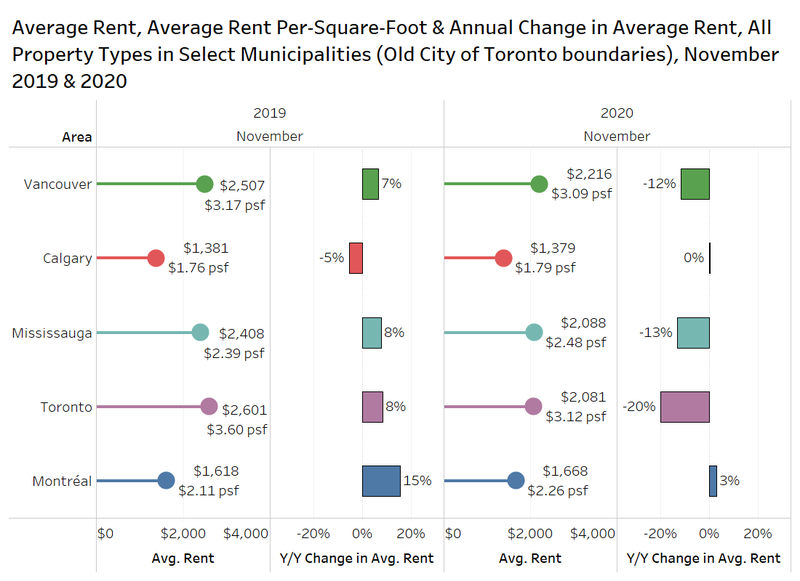 In November of last year, the average rent in Vancouver for all property types on Rentals.ca increased by 7% annually to $2,507 per month. A year later, the average rent is down 12% year over year to $2,216 per month. There was less of a drop in the rent per square foot, falling from $3.17 psf to $3.09 psf. It is worth noting that not all of the listings on Rentals.ca have their size posted by the owner or landlord, so this figure is based on a smaller sample that tends to skew toward newer units, specifically condominium apartment suites.
Calgary rents dropped 5% year over year in November 2019, but are virtually unchanged this year at about $1,380 per month.
The average rent in Mississauga is down 13% annually in November 2020, following an 8% increase in November 2019. However, the rent per square foot actually increased in 2020 to $2.48 psf.
The average property for rent in Toronto is now $520 cheaper per month in November of this year compared to November of last year. The average rent dropped by a whopping 20% annually to $2,081 per month, lower than Mississauga. On a per-square-foot basis, the average rent declined from $3.60 psf to $3.12 psf, a decline of 13%.
Montreal remains a bright spot for landlords in Canada, with rents rising 3% in November 2020, following a 15% rise in November 2019. The rent on a per-square-foot basis is up 7% in 2020.
Vancouver
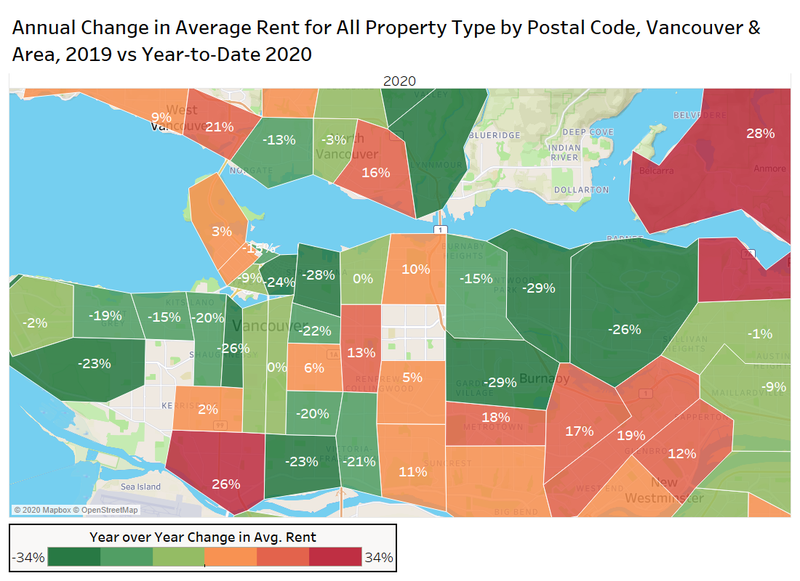
The chart below shows the annual change in average rent for all property types in the city of Vancouver and the surrounding areas in 2020 (January to November) verus 2019 by postal code. There are a few areas where the sample size of listings was too small, so they were eliminated from the map.
Several areas have experienced declines between 15% and 30% annually, including Dunbar-Southlands, Kitsilano, Gastown, Downtown Eastside, and Strathcona.
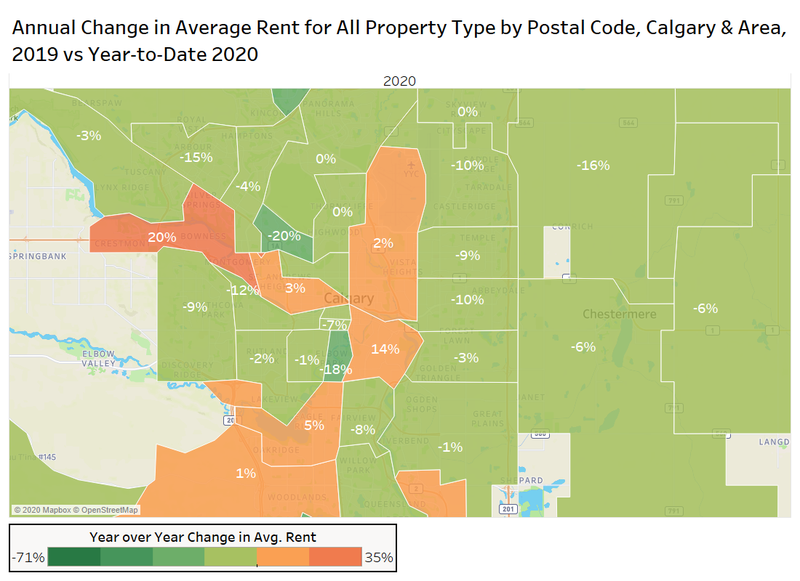
 Calgary
Some of the central postal codes in Calgary experienced some positive rent growth, but many of the postal codes experienced declines of 5% to 10% annually.
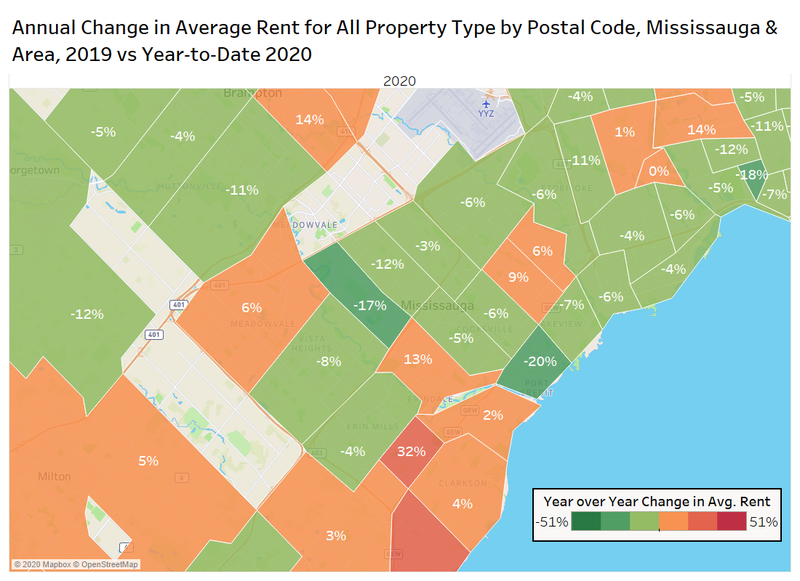
 Mississauga
Some newly completed buildings have driven up rent in a couple of postal codes in Mississauga, however, the two areas with the most activity covering the Mississauga City Centre and Cooksville Areas (L5B and L5C) have seen average rents decline by 5% and 6% annually in 2020.
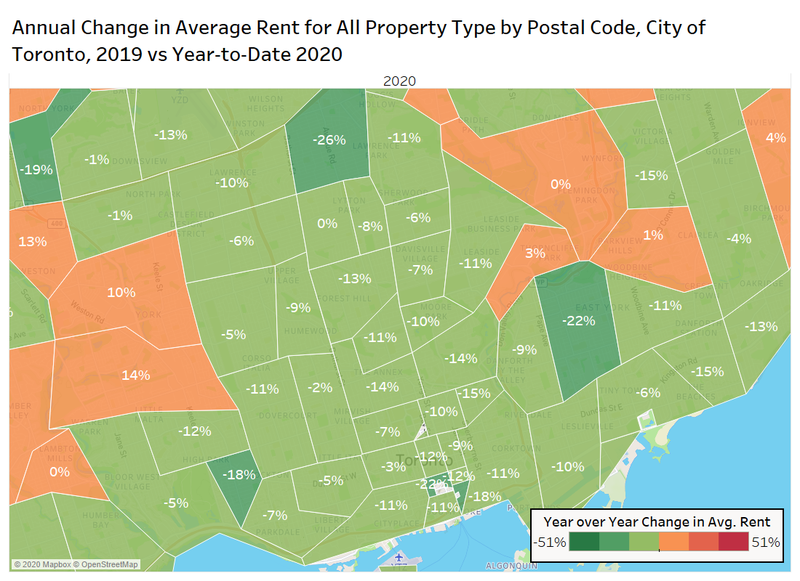
 Toronto
Every postal code in central Toronto has experienced a decline in average rents for all property types, with the majority of neighbourhoods seeing declines of 5% to 15% year over year.
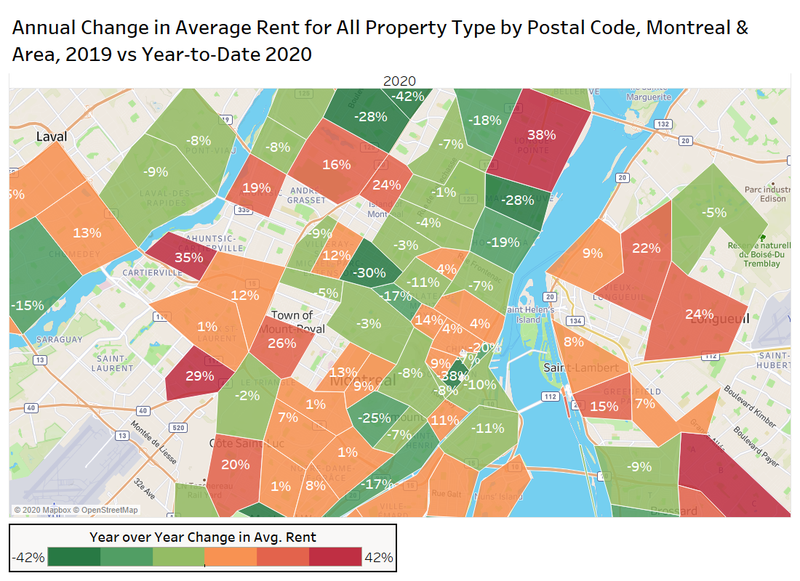
 Montreal
In Montreal, despite a robust sample of listings, there is significant volatility in the average rent levels by postal code. H2X and H3A are two of the most active areas in Montreal and include the downtown core and McGill University. These two postal codes have experienced rent growth of 4% and 9% year over year respectively.
4. Rent Forecasts
The following chart looks at the actual average rent for all property types in Vancouver, Calgary, Mississauga, Toronto and Montreal from December 2018 to November 2019 (thin line), with the thicker line representing the Bullpen Research & Consulting and Rentals.ca forecasts for the next 13 months.
Vancouver is expected to finish the year with the average rent down 9% to $2,170 per month and continue to decline in early 2021. As the vaccine rolls out and consumer confidence returns, our forecast calls for an increase in the average rent of 3% annually to $2,240 per month.
The average rent in Calgary at the end of 2020 is expected to be about $1,350 per month, a 3% annual decline. Our forecast calls for flat rents in 2021.
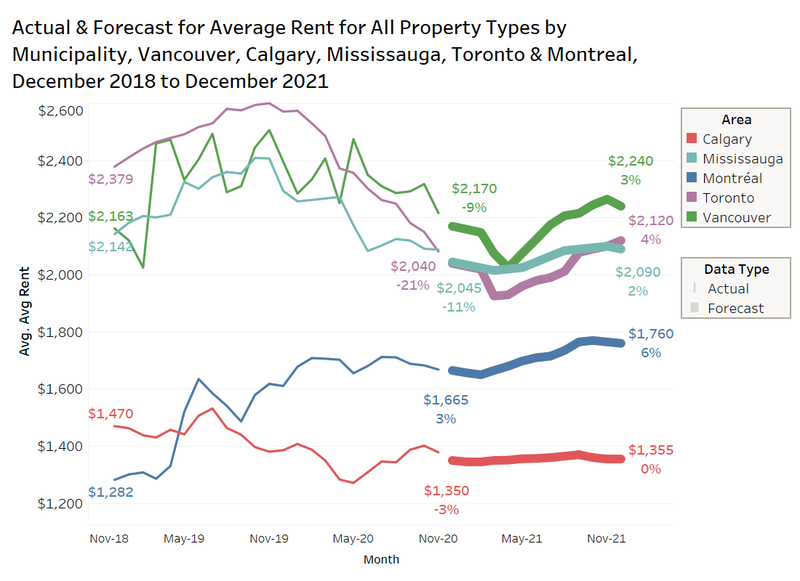 The average rent in Mississauga is expected to top Toronto at $2,045 per month, an 11% annual decline. However, the expectation is that rents will improve in 2021 to $2,090 as of December, a 2% increase year over year.
After topping out at over $2,600 per month in late 2019, the average rent in Toronto (former City boundaries prior to amalgamation) is expected to decline to $2,040 per month in December 2020, a major decline of 21% annually. The average rent is expected to continue to drop in the first quarter of 2021, but slowly start to recover in the second half of the year, finishing at $2,120 per month on average, a 4% annual increase.
Montreal is expected to be the top major market in Canada next year with rent growth of 6%, rising from $1,665 per month forecast for December 2020 to $1,760 per month. There is clearly no urban exodus in Montreal, as despite the strong rent growth in 2019, and the above-inflation increase in 2020, average rents are still relatively affordable in comparison to Vancouver and Toronto.
5. Conclusion
After staying flat for several months, the average rent for all property types in Canada declined in November, as the typical low-tenant-demand months of November, December and January have started.
The national figures are heavily influenced by what is happening in the Greater Toronto Area, where rental rates for condominium apartments have plummeted year over year. When isolating just rental apartments in Canada, average rents are actually up in November 2020 over November 2019, but caution should be taken given the changing sample of listings, and the rental incentives being offered.
Expect rental rates to continue to decline into early 2021 as further lockdown conditions limit in-person viewings, COVID cases increase and the border remains mostly closed to new immigrants. The decrease in demand will be met with an increase in supply, with more apartments (all tenures) expected to be completed in 2020 than any time over the last 30 years. Many of the condominium apartment units were purchased by investors and destined for the rental market.
A crackdown on short-term rentals in the city of Toronto, plus the potential for a vacant homes tax will only increase supply further in Canada’s largest rental market.
However, with the COVID-19 vaccine on the way, it is likely that some tenants will try to time the bottom of the rental market and jump back in during the spring of 2021. Bullpen Research & Consulting and Rentals.ca expect a sizable increase in demand in the fall of 2021, driving rents above December 2020 levels.
Rentals.ca Data
The data used in this analysis is based on monthly listings from Rentals.ca. The data is much different than the more familiar numbers collected and published by Canada Mortgage Housing Corporation (CMHC).
Rentals.ca data includes basement apartments, rental apartments, condominium apartments, townhouses, semi-detached houses and single-detached houses, where CMHC’s primary rental data only includes rental apartments and rental townhouses. CMHC collects some data on the secondary market, but it is reported separately.
The CMHC rental rates are based on the entire universe of purpose-built rental units in Canada (the stock), while Rentals.ca data is primarily based on the asking rents of vacated units only (the flow) — this is a smaller sample size, but more representative of the actual market rent a prospective tenant encounters. The Rentals.ca data set typically produces much higher rental rates in comparison to CMHC, as vacated units are not subject to rent control.
The average and median rental rates via Rentals.ca can also skew higher than CMHC’s data for several reasons: The inclusion of larger and more expensive unit types like singles, row units and condos; the survivorship bias (overpriced units remain in the sample longer); and the multiple listings of the same property at different rent levels every month.
It should also be noted that properties listed for above $5,000 a month and below $500 a month are eliminated from the sample of units analyzed. Also, short-term leases, single-room rentals, and furnished rental units are eliminated from the sample where identifiable.

Rentals.ca is Canada’s premier online marketplace for renters and landlords, providing a comprehensive suite of tools and resources tailored to simplify the rental process. With an extensive selection of listings across the country, Rentals.ca offers user-friendly search functionality that helps renters find their perfect home efficiently. For landlords, Rentals.ca delivers effective advertising solutions to maximize visibility and fill vacancies faster. Committed to innovation and excellence, Rentals.ca aims to empower users with up-to-date market insights and expert guidance, making renting easier and more accessible for everyone.