

The average rent for all Canadian properties listed on Rentals.ca in July 2021 was $1,752 per month, down 1.1% annually, and up 1.8% monthly. The average rental rate increased for the third consecutive month, but is still $200 cheaper than the market peak in September of 2019.
Rentals.ca August 2021 Rent Report
Rentals.ca August 2021 Rent Report
1. National Overview
The median rental rate was $1,649 per month in July, unchanged month over month, but down 3% from $1,700 a year earlier.
The chart below shows the average (red) and median (black) monthly rent for all property types: single-family housing (singles and semis), townhouses, rental apartments, condominium apartments, and basement apartments from the start of 2019 to July of this year.
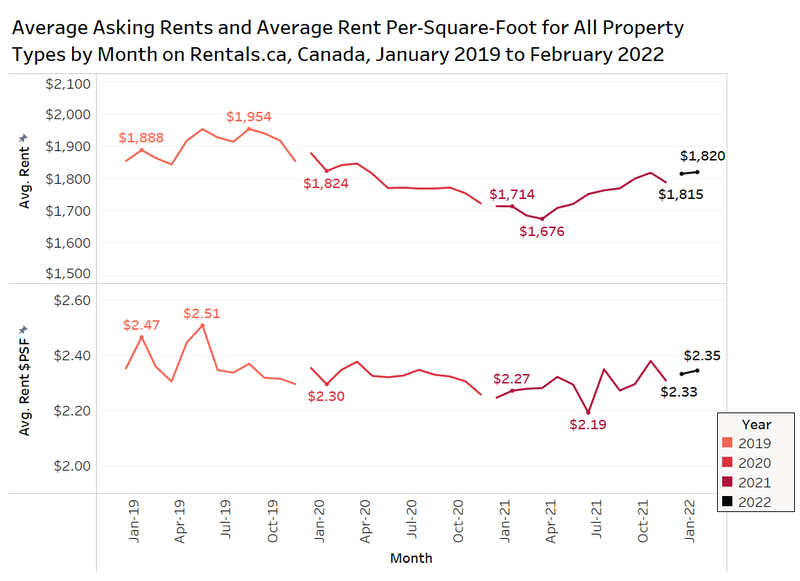 The market peaked in September 2019 at $1,954, falling 14.3% to a low of $1,675 in April of 2021. The average rental rate has since increased by 4.6%.
Average Rent by Property Type and Month
The chart below shows the average rent and year-over-year change in average rent by month in 2021 organized by property type.
Market conditions differ by property type, with single-family homes experiencing a dramatic rise in average rent this year, while condo apartments declined this past month after two consecutive monthly increases.
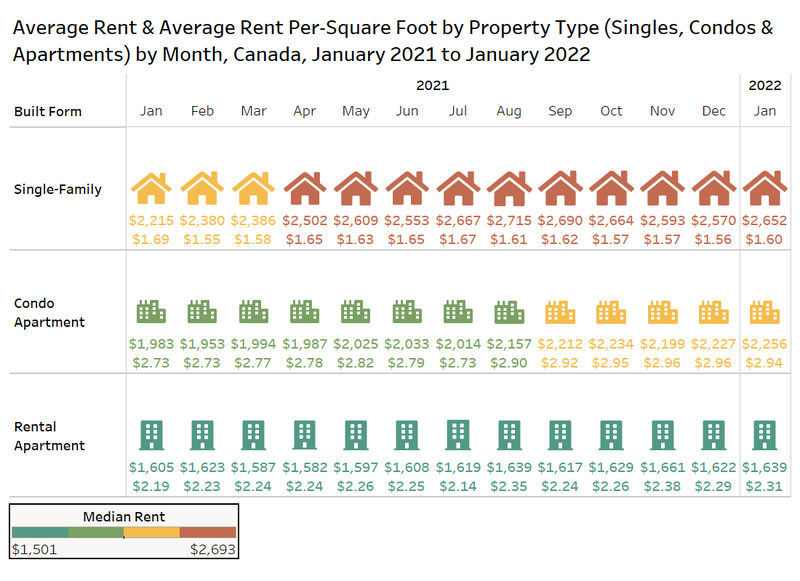 The most expensive units are single-family homes, with landlords asking $2,666 per month on average in July of 2021, an increase of 13.8% year over year. Since January 2021, the average rent for single-family homes has generally trended up.
Condominium apartments have seen average rental rates decline by 8.1% annually to $2,008 per month. While the average rent for a condo apartment has generally fluctuated throughout 2021, the year-over-year change has continued to improve, moving from -19.2% in January 2021 to -8.1% in July 2021. Much of this improvement can be attributed to an increase in activity in downtown Toronto and Vancouver.
Rental apartments, which make up the majority of the listings on Rentals.ca, experienced a year-over-year increase of 1.3% to $1,623 per month in July 2021. Since the start of the year, the average monthly rent declined slightly heading into April 2021, before rebounding and increasing to current levels.
Average Rent Per Square Foot by Property Type
The total number of rental listings analyzed in this report is large, but despite the large sample size, the composition of the listings changes on a monthly basis, and a change in the average unit size can have an outsized impact on the rent levels. Looking at the rent per square foot can help control for some of those swings. Keep in mind unit sizes are not included by the landlord or owner for every Rentals.ca listing.
The data above showed the striking difference between the average rent for condominium apartments and rental apartments, and the opposing direction of their recent movements.
The chart below shows the annual change in average rent per square foot for condominium apartments (left) and rental apartments (right). The diverging market trends are evident as the change in average rent per square foot for condominium apartments are all negative in 2021, The change in average rent per square foot for rental apartments was largely positive, but was down in July 2021.
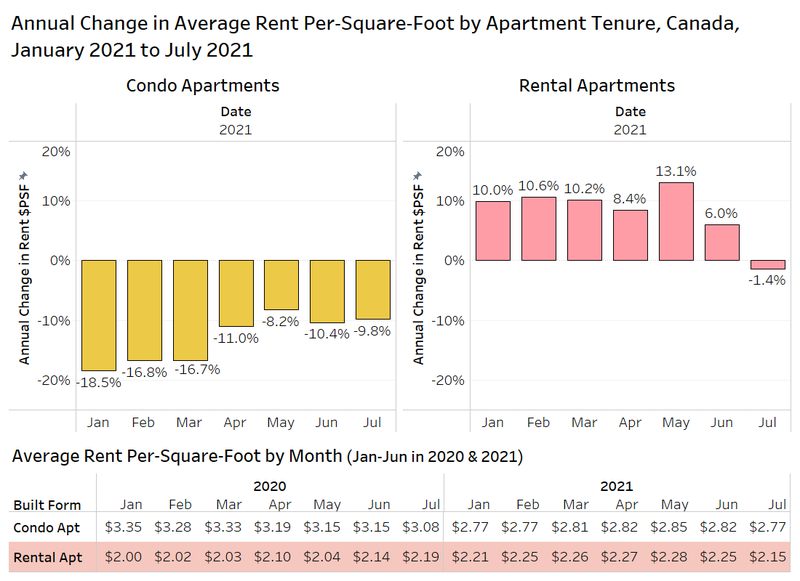 In July 2021, the average rent per square foot for rental apartments was $2.15, decreasing year over year by 1.4%. The average rent per-square-foot for condominium apartments in July 2021 was $2.77, an annual decrease of 9.8%.
It should be noted that rental apartment owners are more likely to offer rent incentives like one or two months free rent compared to condo investors, which are more often to simply reduce their rental rates. This accounts for some of the differences between these two tenures.
2. Provincial Rental Rates
On a provincial level, British Columbia had the highest rental rates in July 2021, with landlords seeking $2,175 per month on average (all property types); an increase of 10.5% monthly and 7.2% annually. This is a huge increase, as tenants are jumping back into the rental market as the economy reopens.
Ontario had the second highest rental rates in July 2021, averaging $2,024 per month. This is an increase of 3.3% monthly, and a decrease of 2.2% annually.
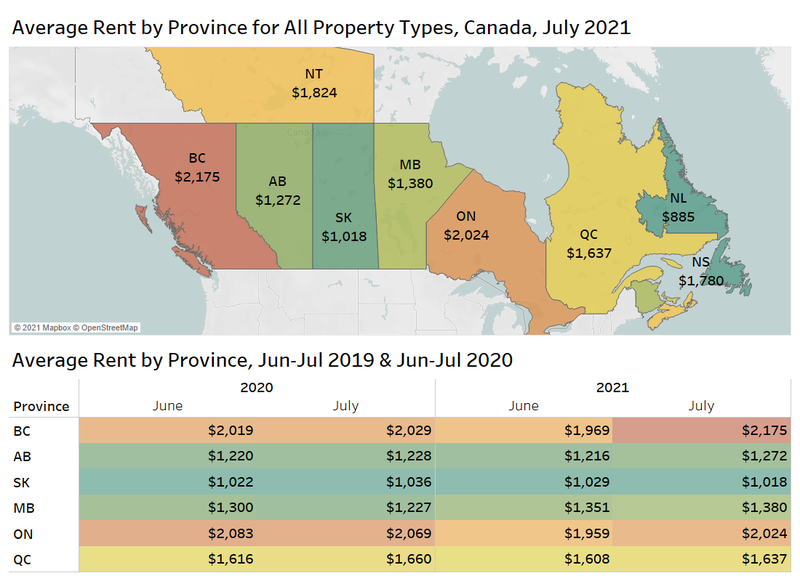 Average rents are up in British Columbia, Alberta, and Manitoba, on a year-over-year basis, but down in Saskatchewan, Ontario and Quebec.
On a monthly basis, 2021 and 2020 are similar in that the majority of the provinces experienced month-over-month increases in average monthly rental rates from June to July. In 2020, only Manitoba and Ontario experienced monthly decreases, while in 2021 only Saskatchewan experienced a month-over-month decrease.
Average Rent by Property Type and Bedroom Count
The chart below shows average rent levels by bedroom type in select provinces for apartments by tenure: condominium apartments (top) and rental apartments (bottom). The data excludes studios and four-bedroom suites. The annual change in average rent is marked below the average rent.
In British Columbia, Alberta, and Ontario, the average monthly rental rate for a two-bedroom unit generally appears to be performing better than one-bedroom units for both condo and rental apartments. Condominium apartments in Alberta were the only market segment where that was not the case (annual decline of 3.5% for two bedrooms compared to 2.7% for one bedrooms).
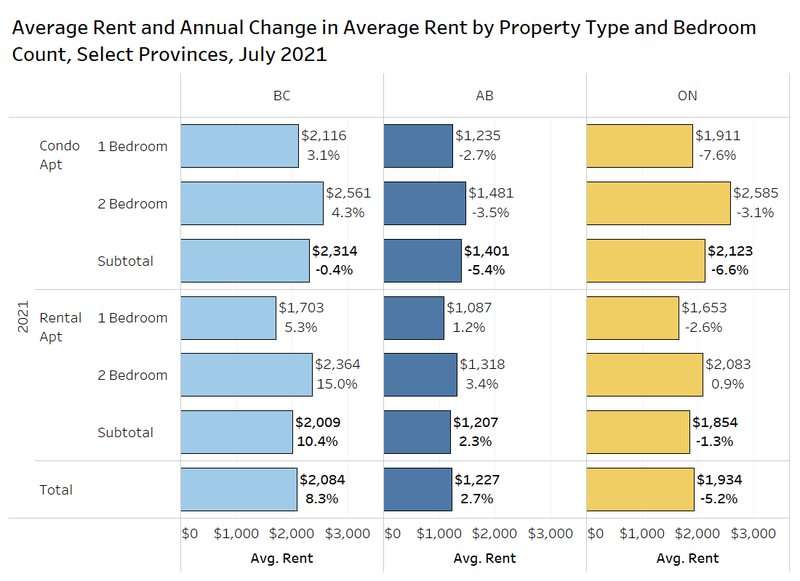 In each of the provinces, rental apartments are performing better than condo apartments in comparison to a year ago.
Overall, apartments in British Columbia realized a monthly rental rate of $2,084 in July 2021 with an increase of 8.3% over July 2020. Ontario maintained an average monthly rental rate of $1,934, but remained down year over year (-5.2%), while Alberta had an average monthly rental rate of $1,227, and an annual increase of 2.7%.
3. Municipal Rental Rates
The chart below presents data on the average rental apartment and condominium apartment rental rates by municipality and area in Canada for July 2020 and July 2021, with the annual percent change in average rent shown on the right (includes former municipalities prior to amalgamation in Toronto).
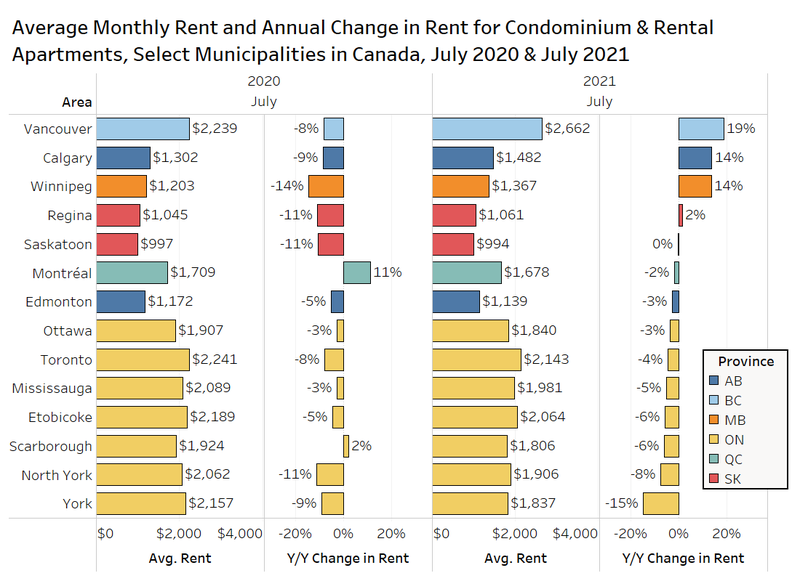 The majority of the municipalities experienced a decline in average rental rates year over year in July 2021,with York experiencing the largest annual decline at 15%, while North York experienced an annual decline of 8%.
Vancouver, Calgary, and Winnipeg are the municipalities that experienced the largest annual increase in average rental rates. Vancouver experienced an annual increase of 19%, while Calgary and Winnipeg both experienced an annual increase of 14% in July 2021. Regina was the only other municipality that showed positive growth in July 2021.
Last year, with the exception of Montreal and Scarborough, most of the major cities experienced annual rent declines in the middle of the pandemic.
Rent Per-Square-Foot Changes by Municipality
The chart below looks at the average rent per square foot in select municipalities and former municipalities for condo and rental apartments in July of this year and July of last year, with the monthly change in the average rent per square foot also shown.
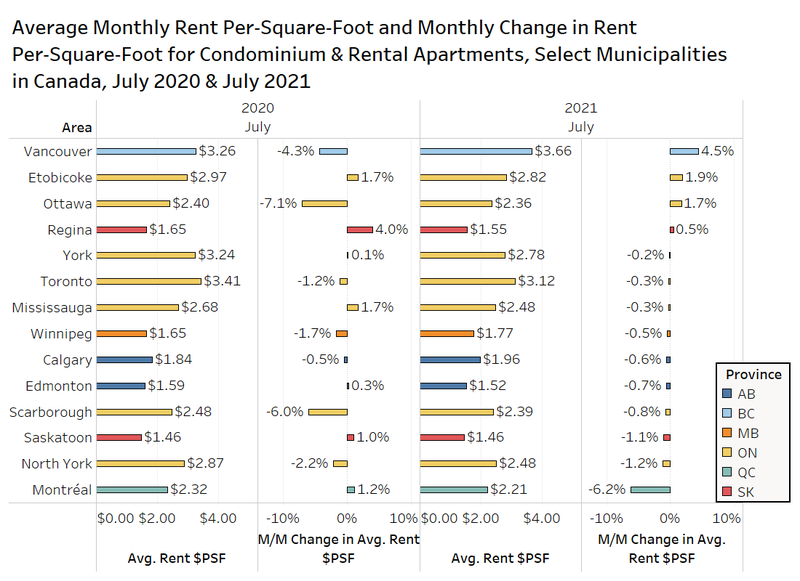 Montreal experienced the largest month-over-month decline in average rent per square foot in July 2021, decreasing 6.2% to $2.21 per square foot.
Vancouver experienced the largest monthly increase in average rent per square foot, increasing 4.5% to $3.66 per square foot, which is also the highest average rent per square foot among the selected municipalities. Etobicoke and Ottawa also experienced increases in average rent per square foot, increasing by 1.9% to $2.82 per square foot and 1.7% to $2.36, respectively.
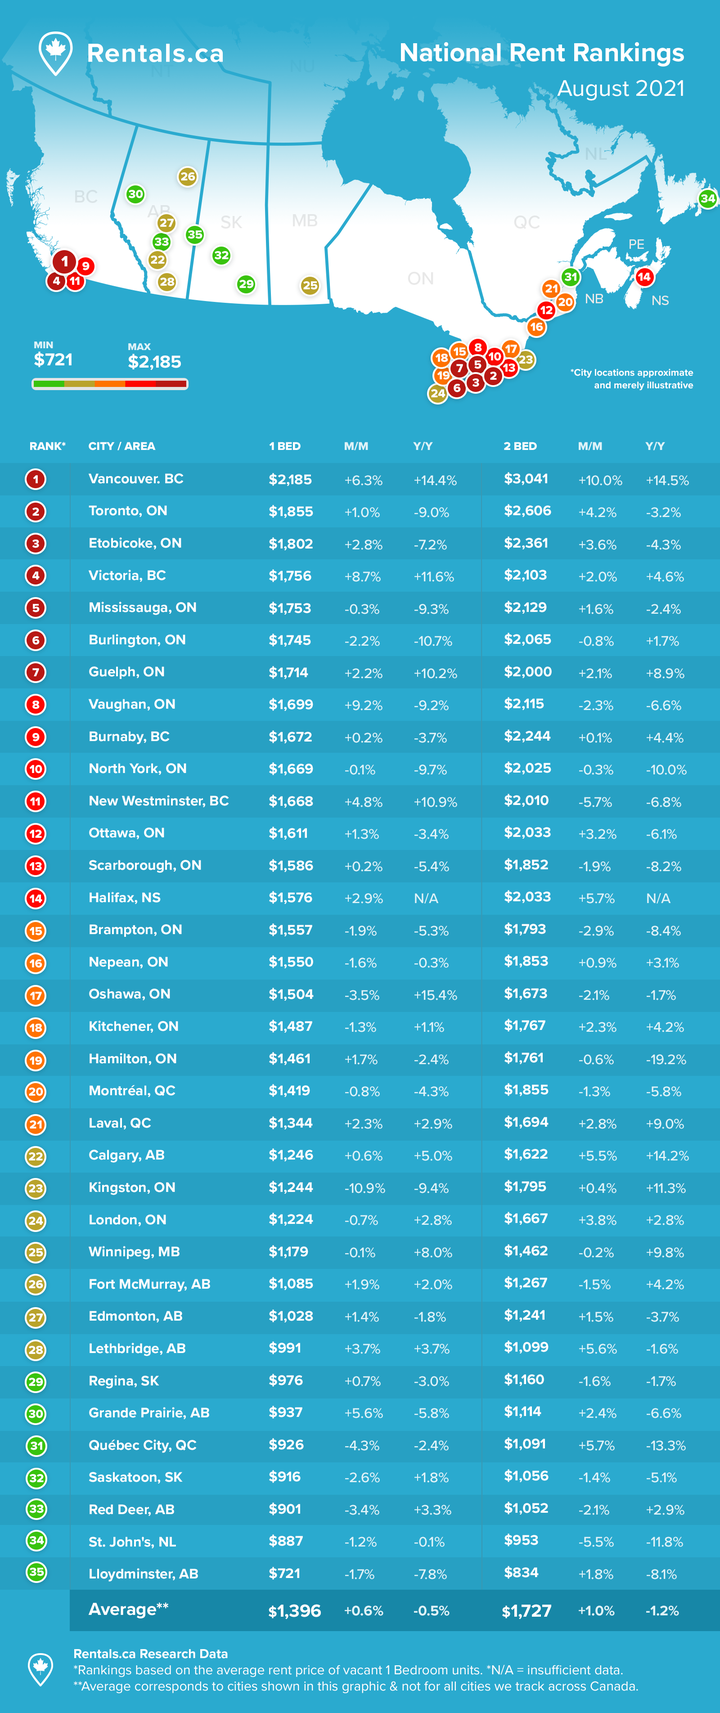
In reference to the top infographic of this report, Vancouver is the best performing municipality in July 2021 in terms of monthly changes, with rents for one-bedroom units experiencing a month-over-month increase of 6.3%, and monthly rents for two-bedroom units increasing by a whopping 10%.
One-bedroom units in Kingston experienced a 10.9% decrease month over month in July 2021, which is the worst out of all the selected municipalities. However, some declines can be attributed to a change in the composition of the listings, not a huge drop in demand.
Montreal
Montreal has an active rental market, and as the previous two charts showed, the COVID-19 pandemic has not had a major negative impact on average rental rates.
The map below looks at the concentration of condominium apartment listings since the start of 2019 on Rentals.ca (left) with the more robust rental apartment listings on the right.
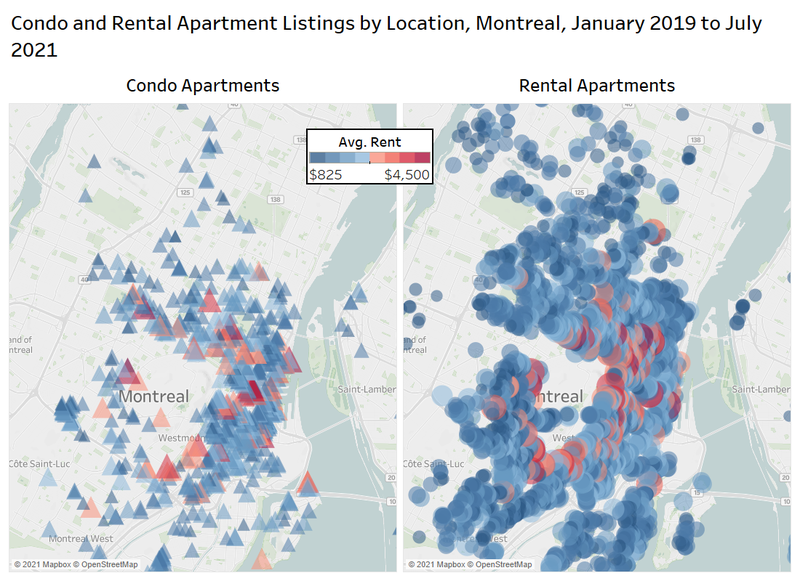 The growth in rental rates in Montreal has been strong over the last couple of years, but often the average rent growth appears to be higher than it is because of a changing composition of units in the Rentals.ca sample. This can happen when the site adds a number of new listings in a prime downtown location, while listings are filled in the less expensive suburban markets.
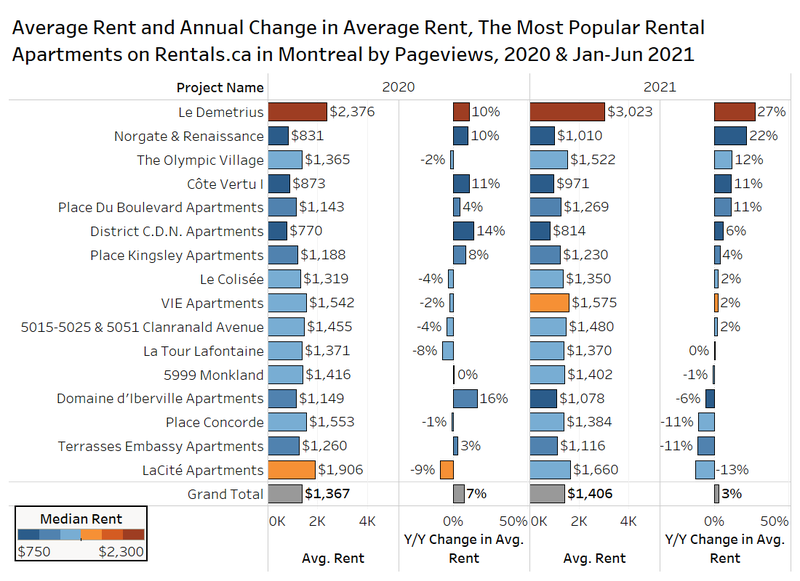
To try to control for that locational skew, the chart below looks at the most popular rental apartments by online pageviews on Rentals.ca over the past 19 months, showing the average rent in 2021 (January to July) compared to the average rent in 2020 overall.
It should be noted that a decrease in the average rent at a project does not necessarily mean that the landlord or owner has dropped rents; it is often a reflection of having more less-expensive one-bedroom units for lease in one period in comparison to more expensive two- or three-bedroom apartments in a previous period.
The real focus is on the total, which suggests that overall in these 16 select popular rental buildings, the average rent is up 3% annually to $1,406 per month, and the market is just as strong as the overall data suggests.
 Old Toronto Rent Percentiles
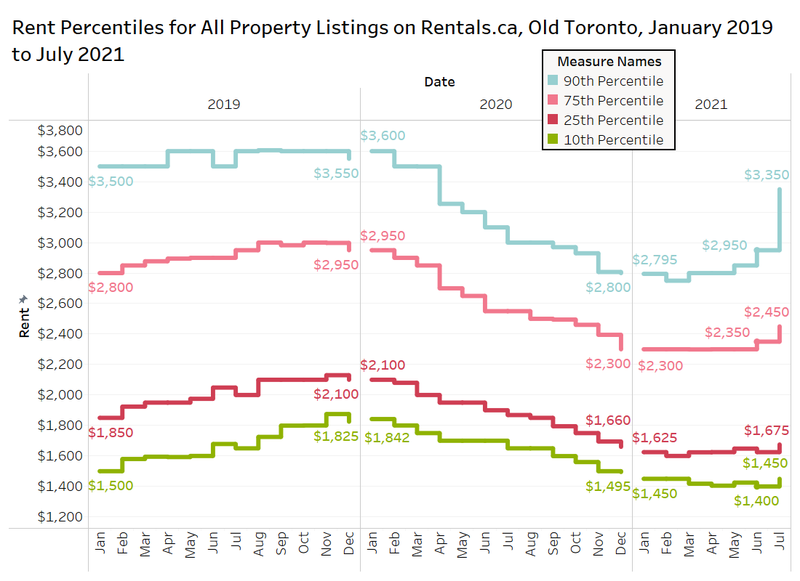
The chart below looks at the rent percentiles for the former city of Toronto, to assess the changes in the luxury rental market and the ‘affordable’ rental market in the old city.
This data shows that in 2021, the average rent for the 10th and 25th percentile have stayed relatively steady, while the 75th and 90th percentile have increased at a much faster rate as it is clear that the luxury rental market is making a comeback in downtown Toronto.
Units in the 10th percentile have stayed at about $1,450 in 2021, while units in the 25th percentile have moved from $1,625 to $1,675 (an increase of 3.1%). By comparison, units in the 75th percentile have increased 6.5% to $2,450 in 2021, while units in the 90th percentile have increased 20% to an average of $3,350 per month.
The most ‘affordable’ units have not increased as fast as the most expensive units in the market, but it is only a matter of time before the lower end of the market gets pulled up..
Real estate agents are again reporting bidding wars for downtown condo rental properties in Toronto.
4. Conclusion
In July of this year, the average rental rate continued its slow and steady climb on a national basis, from the low of $1,675 per month experienced in April. Overall, the average rent for all Canadian properties listed on Rentals.ca in July 2021 was $1,752 per month, down 1.1% annually, and up 1.8% monthly. The market is still down about 10% from the late 2019 market peak.
As the country continues its march back to normalcy, two-bedroom condo and rental apartments are increasing at a faster rate. Tenants continue to show a preference for larger units with many employees expecting to work from home at least part of the time moving forward.
Most of the major municipalities in Canada are still cheaper for renters than one year ago when looking at condo and rental apartments only. Rental rates are still down as much as 15% in some municipalities, while Vancouver, Calgary, and Winnipeg have experienced the largest annual increase in average rental rates. Vancouver posted an annual increase of 19%, while Calgary and Winnipeg both showed an annual increase of 14% in July 2021. One year ago, Vancouver rents were down 8% annually, so that market has experienced a tremendous rebound.
In Toronto, condo and rental apartment average monthly rent is down 4% annually, but up 4% monthly, as the market is bouncing back quickly. With the 75th and 90th percentile units increasing at a faster rate than the 10th and 25th percentile units in Toronto, the idea that larger and more centrally located luxury apartments units are increasing in demand is reinforced. This continues to bolster the idea that more and more tenants are searching for larger living spaces to accommodate working from home and going out less. As the average monthly rental rates for larger units continue to recover, so will the overall rental market.
We will continue to monitor the data and report back on a monthly basis.
Rentals.ca Data
The data used in this analysis is based on monthly listings from Rentals.ca. The data is much different than the more familiar numbers collected and published by Canada Mortgage Housing Corporation (CMHC).
Rentals.ca data includes basement apartments, rental apartments, condominium apartments, townhouses, semi-detached houses and single-detached houses, where CMHC’s primary rental data only includes rental apartments and rental townhouses. CMHC collects some data on the secondary market, but it is reported separately.
The CMHC rental rates are based on the entire universe of purpose-built rental units in Canada (the stock), while Rentals.ca data is primarily based on the asking rents of vacated units only (the flow) — this is a smaller sample size, but more representative of the actual market rent a prospective tenant encounters. The Rentals.ca data set typically produces much higher rental rates in comparison to CMHC, as vacated units are not subject to rent control.
The average and median rental rates via Rentals.ca can also skew higher than CMHC’s data for several reasons: The inclusion of larger and more expensive unit types like singles, row units and condos; the survivorship bias (overpriced units remain in the sample longer); and the multiple listings of the same property at different rent levels every month.
It should also be noted that properties listed for above $5,000 a month and below $500 a month are eliminated from the sample of units analyzed. Also, short-term leases, single-room rentals, and furnished rental units are eliminated from the sample where identifiable.

Rentals.ca is Canada’s premier online marketplace for renters and landlords, providing a comprehensive suite of tools and resources tailored to simplify the rental process. With an extensive selection of listings across the country, Rentals.ca offers user-friendly search functionality that helps renters find their perfect home efficiently. For landlords, Rentals.ca delivers effective advertising solutions to maximize visibility and fill vacancies faster. Committed to innovation and excellence, Rentals.ca aims to empower users with up-to-date market insights and expert guidance, making renting easier and more accessible for everyone.