

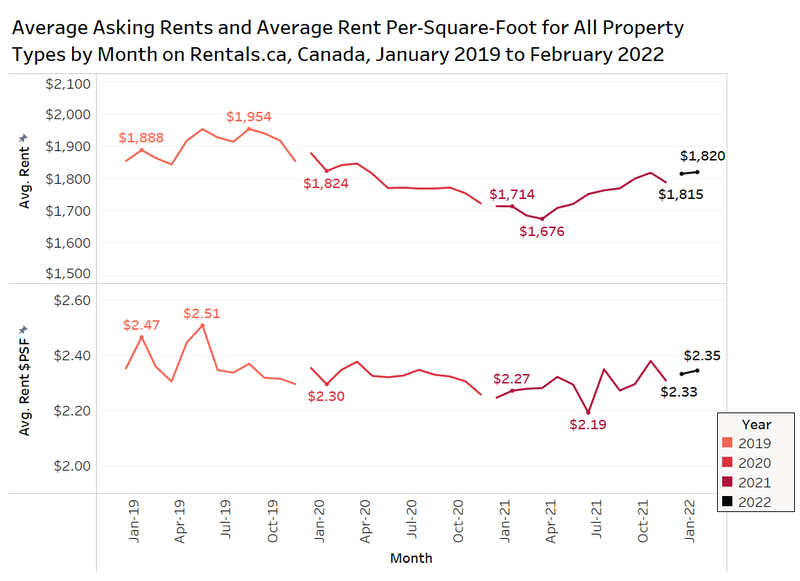
The average rent for all Canadian properties listed on Rentals.ca in July was $1,771 per month, down 8.1% annually. For the first time since September 2019, the average rent increased on a monthly basis, rising by $1.
The median rental rate was $1,700 per month in July, down 6.8% annually, but unchanged month over month.
Rentals.ca August 2020 Rent Report
Rentals.ca August 2020 Rent Report
1. National Overview
The chart below shows the average (red) and median (black) monthly rent for single-family housing, townhouses, rental apartments, condominium apartments and basement apartments from the start of 2019 to July of this year.
 Average Rent by Property Type and Month
Market conditions are different by property type, with the more expensive properties seeing double-digit annual rent decreases, and rental apartments rising by nearly 6% annually in Jul
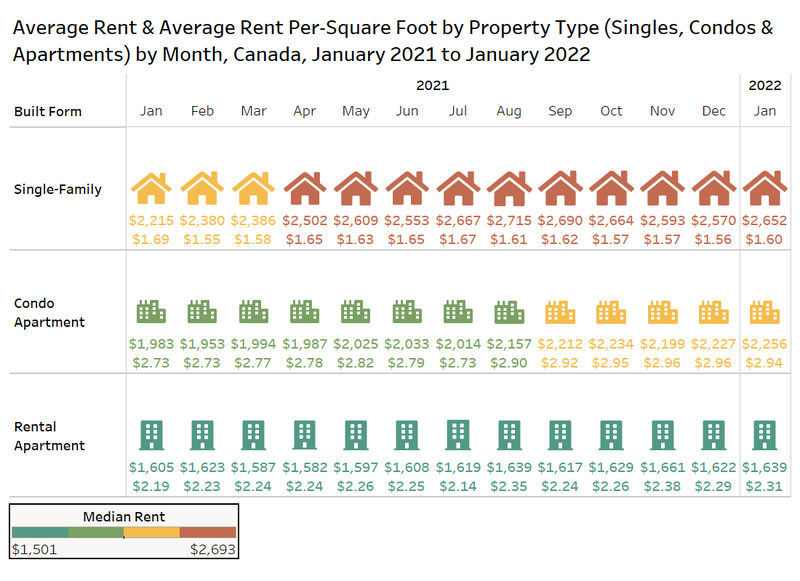 The most expensive units are single-family homes, with landlords asking $2,345 per month on average in July of 2020, a drop of 14.9% year over year.
Condominium apartments for rent have seen average rates decline by 11.4% annually to $2,182 per month. The average condo is nearly $275 per month cheaper in July than it was in January of this year. The bulk of the Rentals.ca condo listings are in Ontario, with the decline in downtown Toronto the main factor in the decline.
Rental apartments, which make up the majority of the listings on Rentals.ca, experienced a year-over-year increase of 5.8%. COVID-19 resulted in lower rents in April and May only, but rental rates have recovered. Several landlords are offering one or two months free rent to entice tenants, but those incentives are more prevalent for newer and more expensive buildings.
Average Rent Per-Square-Foot by Property Type
The total number of rental listings analyzed in this report is quite large, but despite the large sample size, the composition of the listings changes on a monthly basis, and a change in the average unit size can have an outsized impact on the rent levels. Looking at the rent per square foot can help control for some of those swings. Keep in mind unit sizes are not included by the landlord or owner for every Rentals.ca listing.
The data above showed the striking difference between the average rent for condominium apartments and rental apartments, and the opposing direction of their recent movements.
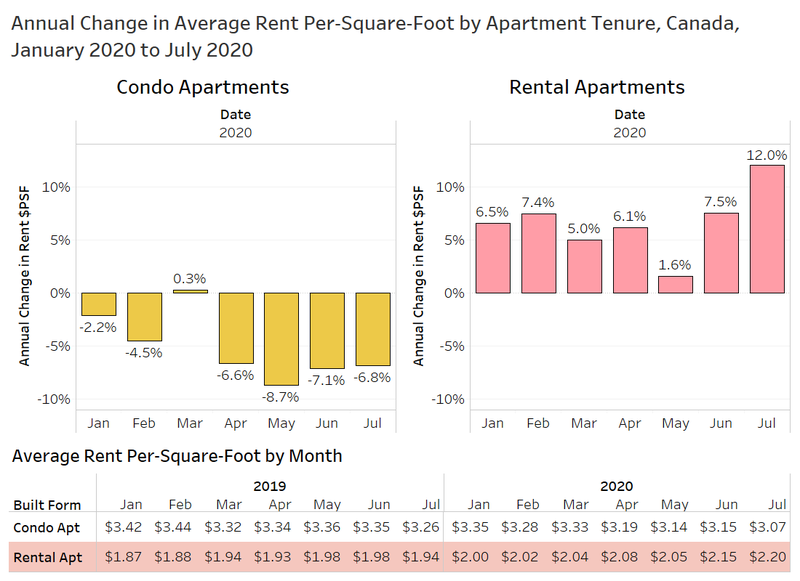
The chart below shows the annual change in average rent per square foot for condominium apartments (left) and rental apartments (right). The diverging market trends are even more evident. Condos are down 6.8% annually from $3.26 per square foot (psf) in July 2019 to $3.07 psf in July 2020. Rental apartments have risen by 12% annually, increasing from $1.94 psf in July 2019 to $2.20 psf in July 2020. To put it in monthly terms, an 800 square-foot apartment would have been offered at $1,550 per month in July 2019 and $1,760 in July 2020, an increase of $210.
2. Provincial Rental Rates
Provincial Rental Rates
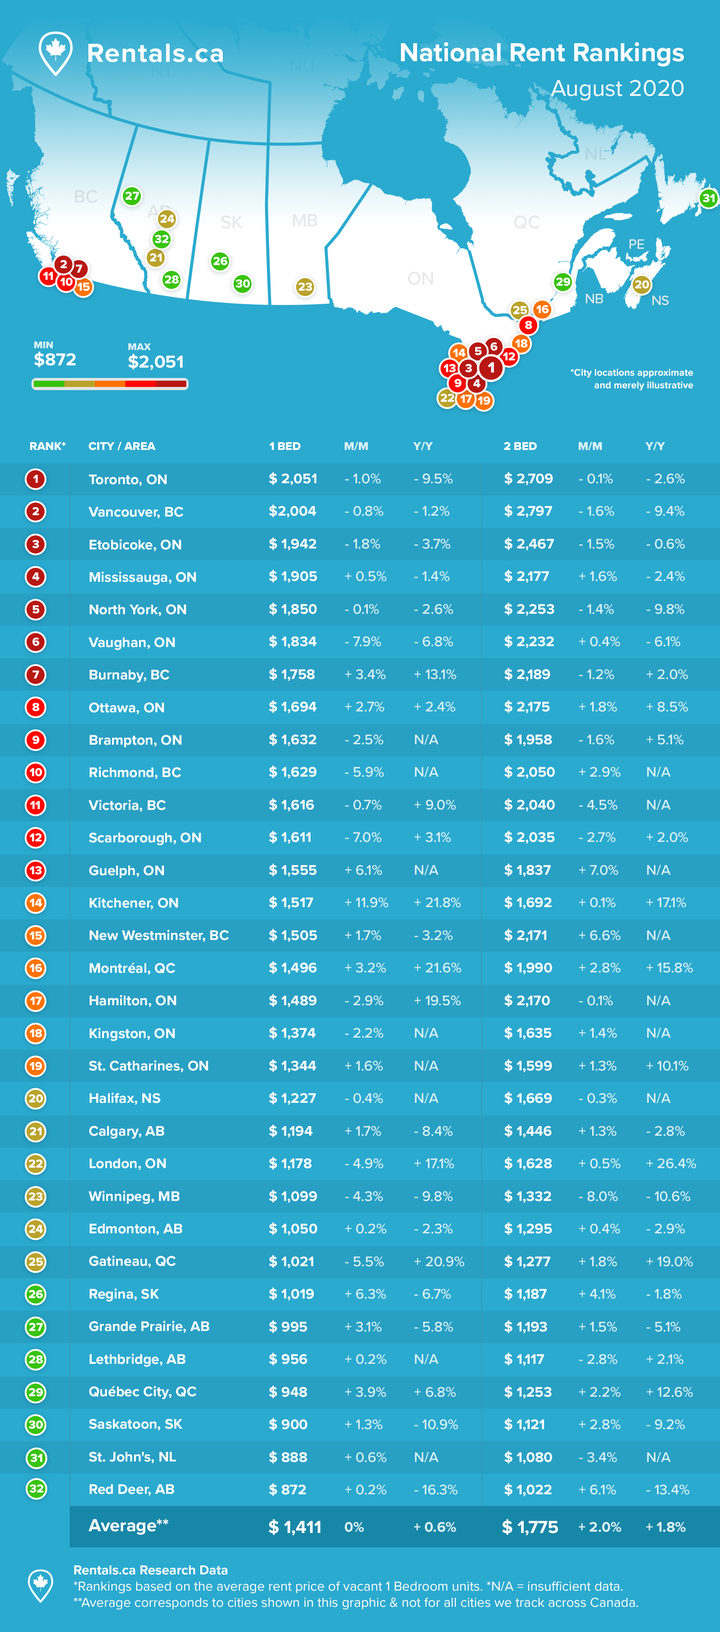
On a provincial level, Ontario had the highest rental rates in July 2020, with landlords seeking $2,069 per month on average (all property types); this is down 0.7% monthly and 9.4% annually.
British Columbia had the second highest rental rate at $2,029 per month, up 0.5% from June and 7.4% from July 2019.
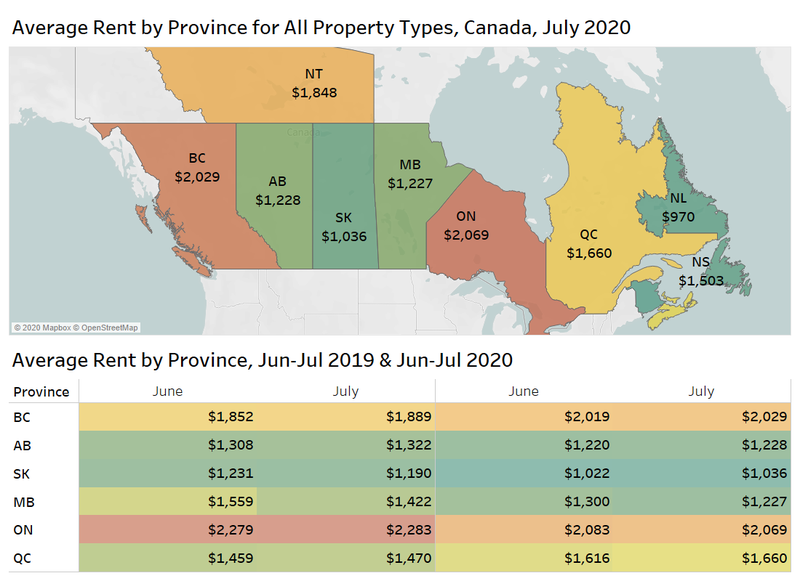 Average rents are up in Quebec on a year-over-year basis, but down in Alberta, Saskatchewan and Manitoba.
Average Rent by Property Type and Bedroom Count
The chart below shows average rent levels by bedroom type in select provinces for apartments by tenure: condominium apartments (top) and rental apartments (bottom). The data excludes studios and four-bedroom suites.
The more expensive condos have declined in British Columbia (-8.4% Y/Y), Alberta (-4.8% Y/Y), and Ontario (-9.2%). The biggest annual decline in each of the three provinces is for one-bedroom units. With people working from home, it is possible that tenants are leaving their small and more expensive one-bedroom condos, and looking for larger two-bedroom rental apartments. In British Columbia, the average rent for two-bedroom rental apartments was up 20% annually, while Ontario’s average rent was up 5% annually for two-bedroom apartments.
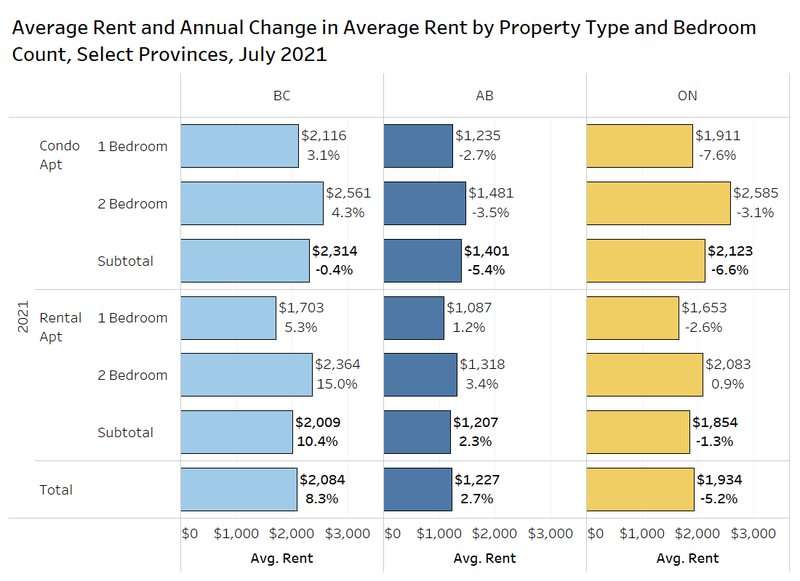 Condominium apartments are listed for rent at a 20% to 30% premium over the average rental apartment in Alberta, British Columbia and Ontario, which is down from 30% to 35% from six months ago.
3. Municipal Rental Rates
The chart below presents data on the average rental apartment and condominium apartment rental rates by municipality and area in Canada for July 2020, with the annual percent change in average rent shown on the right (Includes former municipalities prior to amalgamation in Toronto).
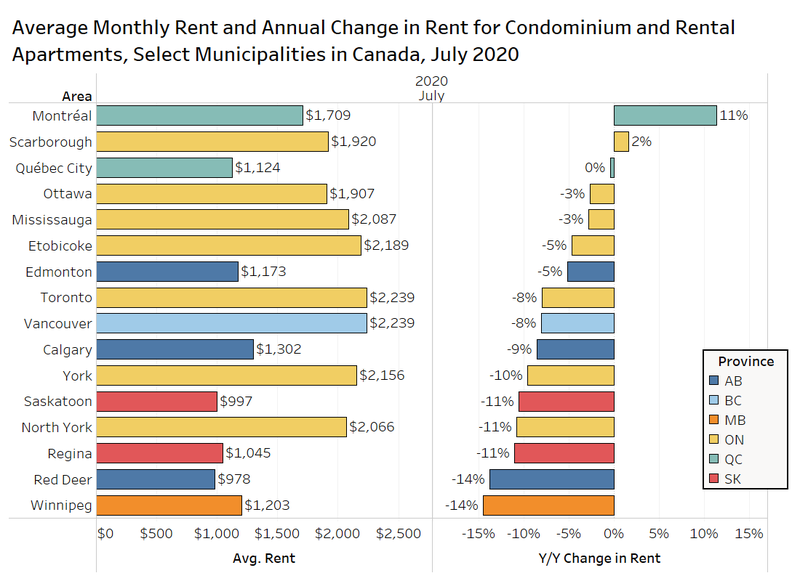 Almost every major municipality and former municipality experienced a decline in average rental rates year over year for condo and rental apartments, with Saskatoon, North York, Regina, Red Deer and Winnipeg all experiencing drops of 11% or more from July 2019 to July 2020.
Montreal and Scarborough were the only areas experiencing rent growth, with Montreal up 11% annually and Scarborough up 2%. Both Toronto and Vancouver are down 8% annually.
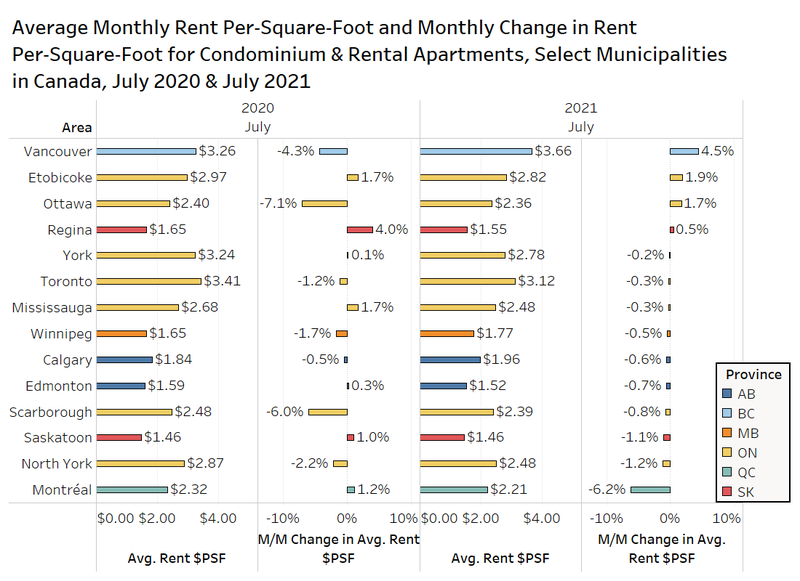
The chart below looks at the average rent per square foot in select municipalities and former municipalities for condo and rental apartments in July (left) with the monthly change in the average rent per square foot shown on the right.
Both Red Deer and Regina increased by more than 4% monthly, but the sample of listings with unit sizes included is smaller in those cities, which can lead to monthly rent volatility. Other western cities like Saskatoon and Edmonton experienced month-over-month growth in their average per-square-foot rent levels.
In the GTA, the average rent per square foot was highest in Toronto at $3.41 psf, followed by York at $3.23 psf, Etobicoke at $2.98 psf, North York at $2.86 psf, and Scarborough at $2.47 psf. Toronto rents continue to trend downward, falling 1.2% monthly, while Scarborough experienced a much deeper drop at 6.1% from June 2020 to July 2020.
4. Montreal Insights
Montreal has an active rental market, and as the previous two charts showed, the COVID-19 pandemic has not had a major negative impact on average rental rates.
The map below looks at the concentration of condominium apartment listings since the start of 2019 on Rentals.ca (left) with the more robust rental apartment listings on the right.
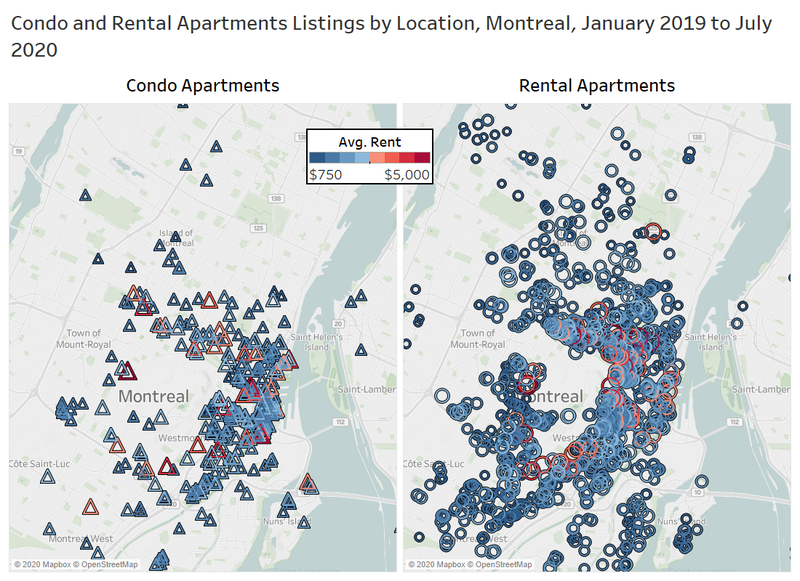 The growth in rental rates in Montreal has been strong, but often the average rent growth appears to be higher than it is because of a changing composition of units in the Rentals.ca sample. This can happen when the site adds a number of new listings in a prime downtown location, while listings are filled in the less expensive suburban markets.
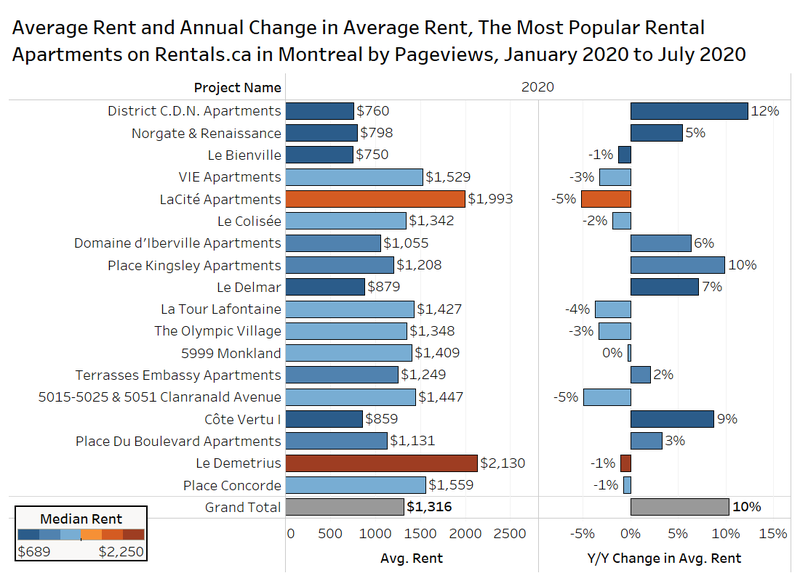
To try to control for that locational skew, the chart below looks at the most popular rental apartments by online pageviews on Rentals.ca over the past 20 months, showing the average rent in 2020 (January to July) compared to their average rent in 2019 overall.
It should be noted that a decrease in the average rent at a project does not necessarily mean that the landlord or owner has dropped rents; it is often a reflection of having more less-expensive one-bedroom units for lease in one period in comparison to more expensive two- or three-bedroom apartments in a previous period.
The real focus is on the total, which suggests that overall in these 18 popular rental buildings, the average rent is up 10% annually, and the market is just as strong as the overall data suggests.
5. Toronto Insights
With a significant percentage of employees now working from home, many are reconsidering their housing choices.
Many tenants chose expensive downtown condominium apartments because they wanted to walk to work, they wanted to take advantage of all the shared amenities, and they didn’t mind a smaller unit with the latest interior finishes. Many residents prioritize their housing choice to live in a neighbourhood that fits their needs and preferences. It’s not necessarily about the four walls that define their suite.
COVID-19 has changed those dynamics. The proximity to work, cultural institutions, concert facilities, bars and clubs, and transportation are valued less when many of those amenities are now either closed or operating in a much different way. Tiny condos were just a place to sleep and cook a few meals a week; now they need to also function as a home office. Many tenants are doing much more cooking at home as well. For couples with young children, not only is their home an office for two people, but it now also has to function as a mini-daycare.
At least temporarily, downtown Toronto has become less valued by tenants, who can easily move elsewhere when their lease is up, and return in one year’s time. In previous years when rents were skyrocketing, it would be inconceivable to many tenants to leave a rent-controlled suite. But with rents declining downtown and the needs of residents changing, preferences and market demand has shifted. The impact has been mst heavily felt in the condo rental market.
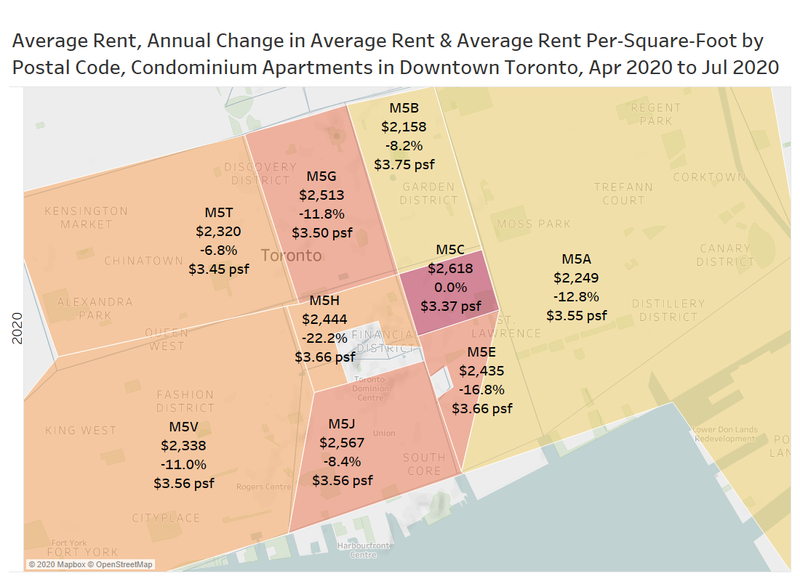
The chart below shows Toronto’s downtown core, broken up into nine postal codes. Each postal code with condominium apartment rental listings has the average rent, annual change in average rent and rent per square foot shown for July 2020.
M5V is one of the most active postal codes for condo rental activity in the country, and includes the Entertainment District, King West and Cityplace. The average asking rent in July for condos based on Rentals.ca listings was $2,338 per month, which is down 11% annually.
M5A represents downtown west, specifically the Distillery District, West Don Lands, Corktown, Regent Park and Moss Park. Average monthly rent is down 13% annually to just under $2,250 per month.
 How do the average condo rent declines in downtown Toronto compare to other areas of the GTA. The chart below shows the downtown core at the top (the nine postal codes highlighted above), the outer ‘416’ area in the middle, and the inner suburbs at the bottom. The data covers Rentals.ca condo listings from January 2019 to July 2020.
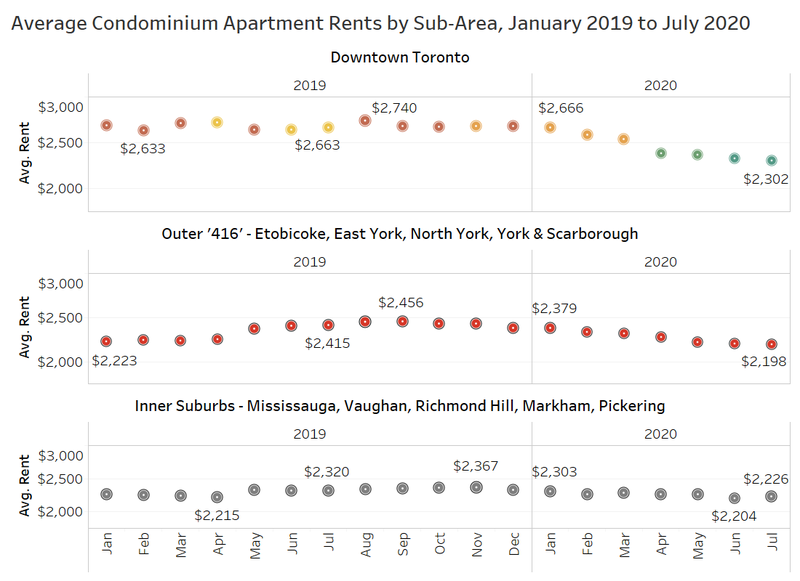 Downtown condo rents peaked at $2,740 per month in August of 2019, and the $2,302 average rent in July 2020 is down 16% from the high water mark (-14% annually from July 2019).
The outer ‘416’ market of Etobicoke, East York, North York, York and Scarborough peaked at $2,456 per month for condo apartments in September 2019, rents have declined 11% since (-9% annually).
The inner suburban markets of Mississauga, Vaughan, Richmond Hill, Markham and Pickering have fallen from $2,367 per month in November 2019 to $2,226 in July 2020, a 6% drop (-4% annually).
It is clear that the core of Toronto is feeling the impact of COVID-19 more than the other areas of the GTA. As mentioned in previous reports, the influx of units previously used at short-term rentals, the growing number of new apartment completions (all tenures), and the cancellation of most on-campus classes at downtown colleges and universities are all contributing to the bigger declines.
6. Conclusion
For the first time this year, the average rent for all property types in Canada increased month over month, rising $1 from $1,770 per month to $1,771 per month. However, average rents nationally are still down 9.4% from the market peak of $1,954 average asking rent in September of 2019.
As the economy starts to re-open, and new COVID-19 cases continue to decline in most provinces, many tenants will have renewed interest in right-sizing and adjusting their living arrangements.
With the exception of Montreal, rental rates are flat or declining in most major metropolitan areas in Canada, with a particularly poor showing for downtown Toronto condo apartments. Anecdotally, we hear stories of tenants looking for larger units in less affluent areas to accommodate their work-from-home needs, while also acquiring more living space due to the much greater time spent at home. Alternatively, some tenants are looking for less expensive places to live as their jobs have been lost, their hours cut, or they worry about their industry and their employment in the face of massive economic shifts due to the pandemic.
It is clear that low interest rates are enticing some tenants with stable jobs to buy homes, many outside the core of cities, and data is showing a greater desire for cottage properties far from major cities.
From the perspective of Bullpen Research & Consulting, interest in market studies for new rental apartments remains strong, and the development community in southwestern Ontario remains bullish, but the enthusiasm is a bit more tempered.
Some of the rent declines shown on a national, provincial and municipal level are the result of steeper declines for the most expensive product in the market, as growth was back up to double-digits annually for rental apartments in Canada in July on a per-square-foot basis, with monthly rental apartment asking rent up 6% year over year after falling into negative territory just two months ago.
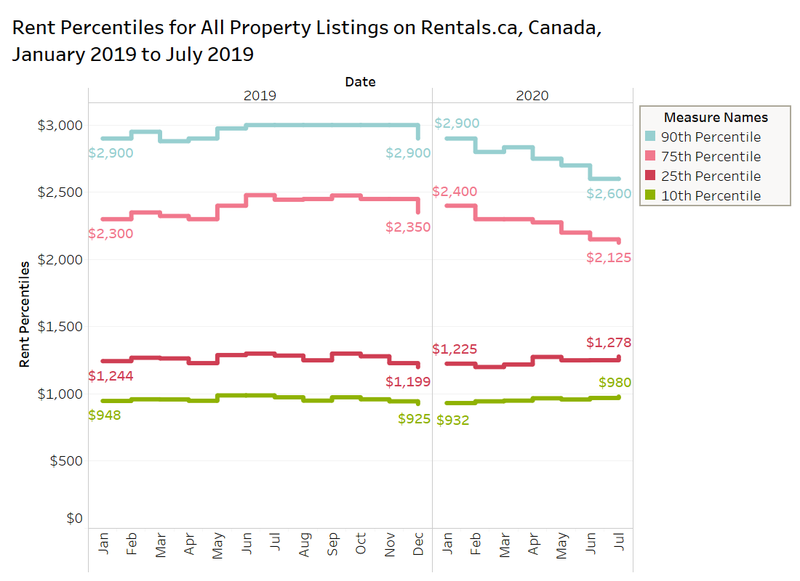
The chart below shows the rent by percentiles for all property types. The cheapest units at the 10th and 25th percentile are up from January 2020, while the 75th and 90th percentiles are way down.
 The rental market is recovering, but the national data for all property types will not show this recovery until the luxury rental market returns, which may take some time. Immigration needs to return, boomers need to feel comfortable moving down to large rental suites, and affluent young professionals need to feel the need to be back downtown in swanky new condos.
We will continue to monitor the data and report back on a monthly basis.

Rentals.ca is Canada’s premier online marketplace for renters and landlords, providing a comprehensive suite of tools and resources tailored to simplify the rental process. With an extensive selection of listings across the country, Rentals.ca offers user-friendly search functionality that helps renters find their perfect home efficiently. For landlords, Rentals.ca delivers effective advertising solutions to maximize visibility and fill vacancies faster. Committed to innovation and excellence, Rentals.ca aims to empower users with up-to-date market insights and expert guidance, making renting easier and more accessible for everyone.