

Rentals.ca April 2021 Rent Report
Rentals.ca April 2021 Rent Report
1. National Overview
The COVID-19 pandemic has been with us more than a year now and has had a dramatic impact on the rental market in Canada. With few immigrants, few students moving close to school, and few recent graduates moving closer to their first jobs, demand has fallen dramatically.
Add a feverish resale housing market brought on by low borrowing costs, and people reassessing their living conditions in the work-from-home era, we are in the middle of the biggest housing shake-up in our nation’s history.
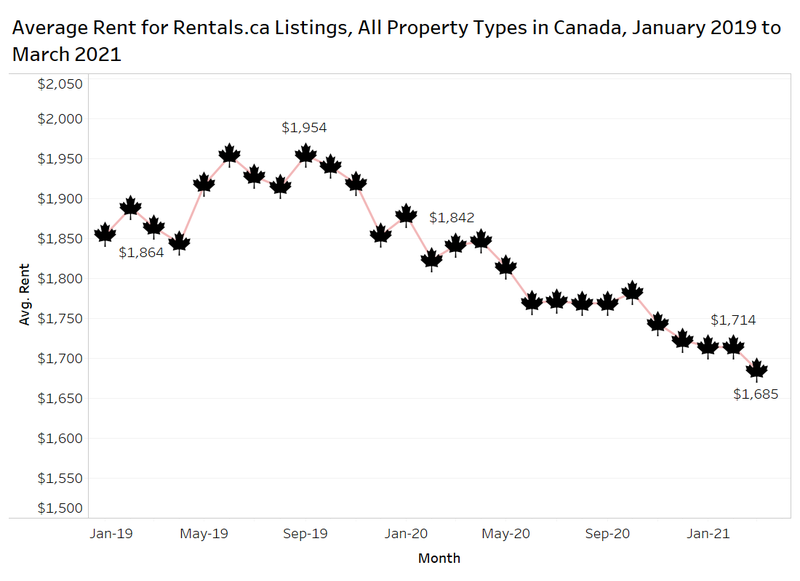
Based on listings on Rentals.ca, the average rent for all Canadian properties in March was $1,685, a continued slide from February, and an annual decrease of $157 per month (-8.5% year over year) from March 2020.
 Median Rental Rates
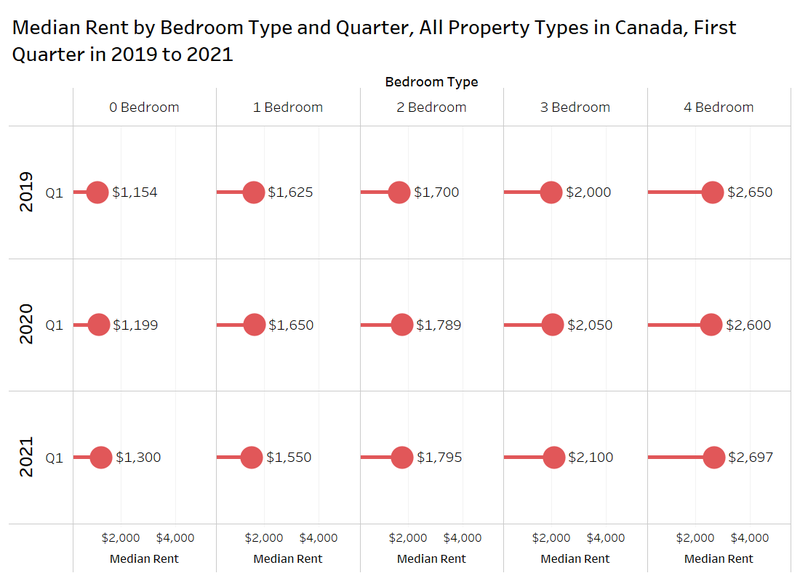
The chart below shows the median rent and median rent per square foot during the first three months of the year in 2019, 2020 and 2021.
The median rent in March 2021 slipped to $1,625 after two stable months in January and February at $1,650, and down 7.1% annually ($125 per month).
However, the median rent per square foot inched higher by $0.01 over February, and increased by 7.8% over March 2020.
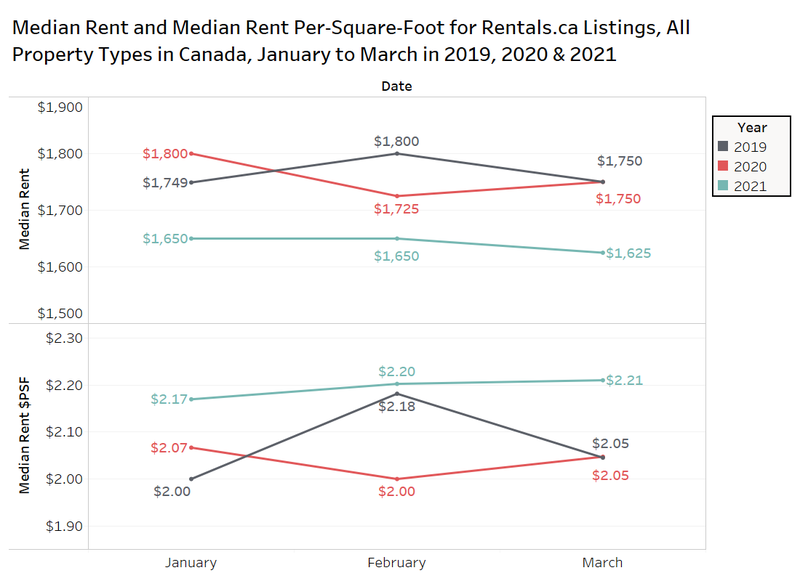 There are a large number of smaller condos for rent in Toronto and Vancouver in 2021 versus 2020, which has contributed to the rise in the median rent per square foot on a national basis, and a decline in the average rent.
The composition of listings can have a big impact on the average and median results on a monthly and quarterly basis, as smaller units have experienced less demand in the work-from-home era, contributing to their increase in listings and increase in rent per square foot.
Average Product for Rent
The chart below looks at the average size of units listed on Rentals.ca by property type, as well as the average number of bedrooms, the average number of bathrooms, and the average rent per square foot. The data covers Q1-2020 (left) and Q1-2021 (right).
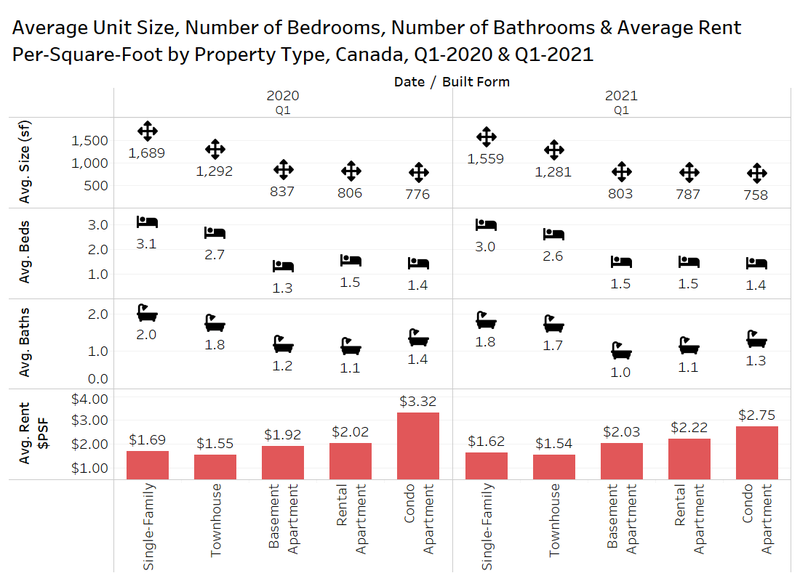 Compared to the first quarter of last year, unit sizes decreased in every category. Single family homes showed the greatest annual decrease in square footage at 130 square feet (sf), followed by basement apartments at 34 sf, rental apartments at 19 sf, while townhomes and condo apartments were down by 18 sf. This is likely due to the higher demand for larger properties, resulting in a higher share of listings with less square footage.
The average number of bedrooms per property type are nearly identical year over year.
In terms of rent per square foot, condo apartments took a large hit, down 17% annually to $2.75 per square foot on average. Rental apartments and basement apartments both showed increases, with rental apartments increasing by $0.20 per square foot, while single-family and townhouses both had small decreases, $0.07 and $0.01 respectively. To reiterate, much of the increase can be attributed to a decline in the average unit size, as opposed to a big increase in demand.
Median Rent by Bedroom Type
Average rental rates can be deceiving, as they can often be skewed by some high-priced suites, or influenced by a change in the make-up of the sample being analyzed (by built form, tenure, unit size or location). There could be more large single-family homes for rent in one quarter, versus more small basement apartments in another quarter. So changes in the data are influenced by the change in the units examined, not changes in demand.
One way to combat this is to look at median rents, as was done in the second chart. That chart showed that median rent was down in 2021 versus 2020 and 2019.
However, one of the factors influencing the median rent is tenants’ preference for larger suites right now as mentioned previously, with renters looking for space for an office or space to accommodate virtual learning. This can result in smaller units leasing slower, and the share of one-bedroom suites growing as a percentage of total listings.
The listings data on Rentals.ca shows more studio, one-bedroom and two-bedroom suites, and fewer three-bedroom, four-bedroom and five-bedroom units.
Comparing the median rents for Q1-2021 to Q1-2020, all bedroom types experienced a slight increase in median rent except units with one bedroom. Studio units experienced an annual increase of 8.4% ($101 per month); two-bedroom units saw an increase of 0.3% ($6 per month); three-bedroom units experienced an increase of 2.4% ($50 per month); and four-bedroom units experienced an increase of 3.7% ($97 per month). One-bedroom units, on the other hand, saw a median rent decrease annually by 6.1% ($100 per month).
Despite the overall numbers in Canada, when controlling for the number of bedrooms, the market looks better than previously thought. Outliers can have a big impact on the average (the five- and six- bedroom properties), so looking at the median by bedroom type is useful.
2. Provincial Rental Rates
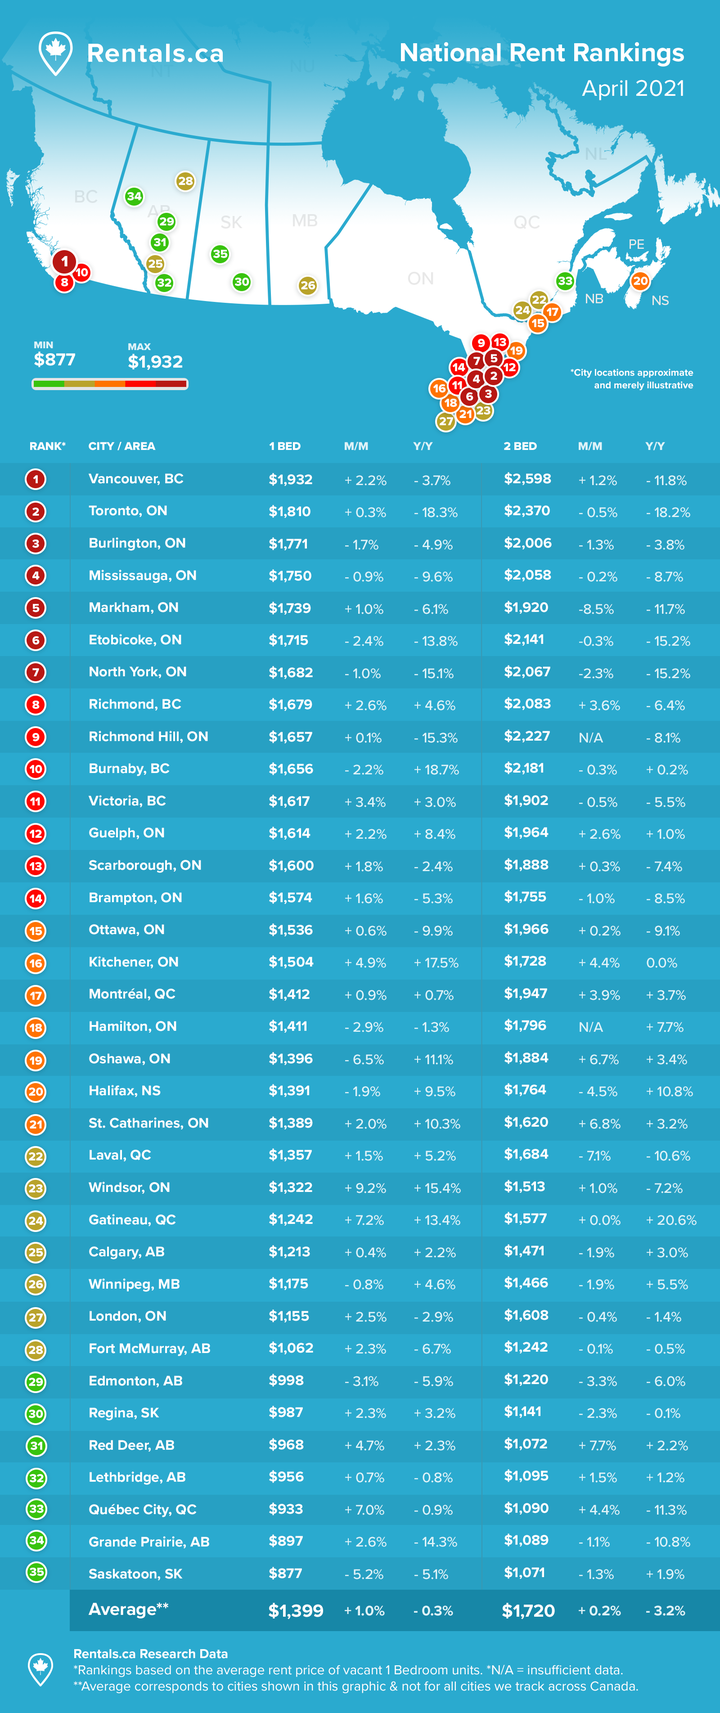
On a provincial level, British Columbia remained on top, edging out Ontario for the highest national rental rate in March 2021, with landlords seeking $1,915 per month on average (all property types). At $1,905, Ontario’s rental rate was second highest, while Newfoundland and Labrador was the lowest at $934.
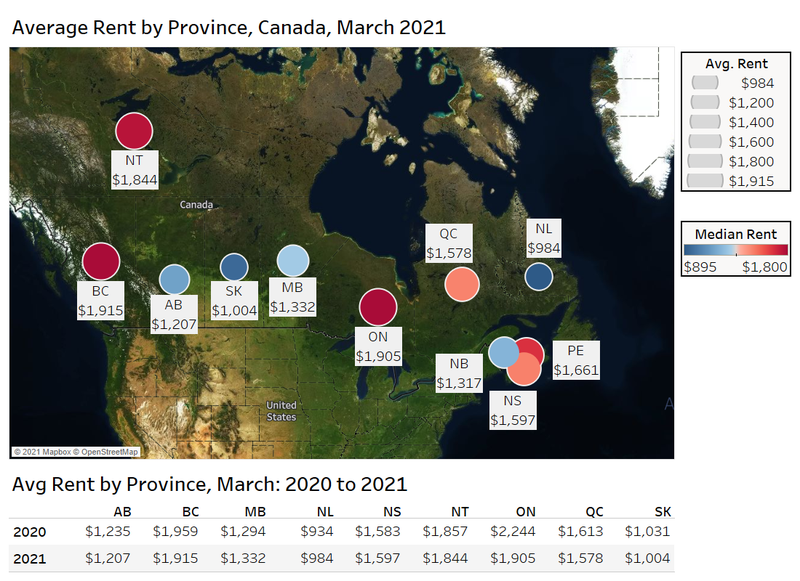 Ontario experienced the highest annual decrease of 15.1%, a $339 difference from March of 2020. British Columbia, Alberta, Saskatchewan, Northwest Territories, Ontario and Quebec all decreased yearly. Newfoundland (5.4%), Manitoba (2.9%) and Saskatchewan (0.9%) were the only provinces to see increased year-over-year average rent.
Provincial Rental Apartment Rates by Bedroom Type
The chart below shows the average rent by bedroom type for rental apartments in select provinces in March. Average rents in British Columbia were the highest in the country for each category, with Saskatchewan the lowest (based on the seven provinces analyzed).
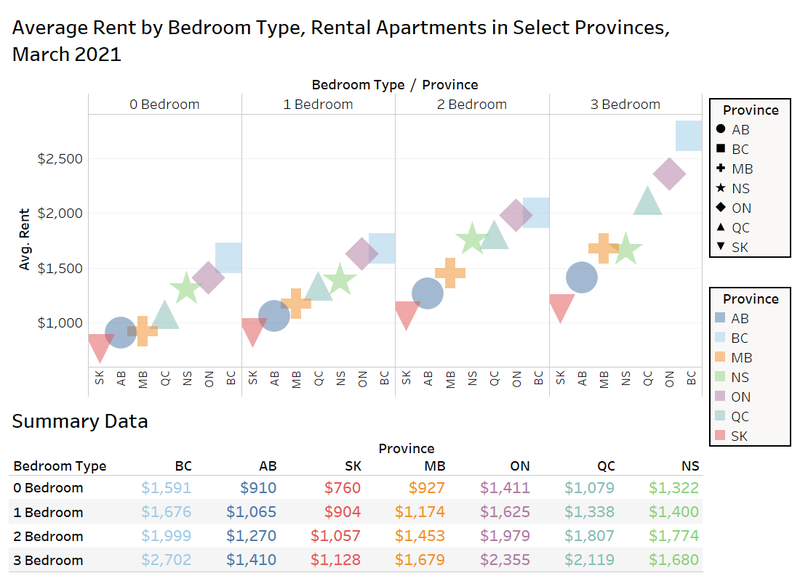 One-bedroom units ranged from a high of $1,676 in British Columbia and $1,625 in Ontario to a low of $904 in Saskatchewan. It costs a tenant a little more than half as much to live in Saskatchewan than British Columbia.
Average rent for a two-bedroom unit was $1,999 in British Columbia, $1,979 in Ontario, followed by $1,807 in Quebec and $1,774 in Nova Scotia.
Monthly rents for three-bedroom units ranged widely in rates across the provinces. British Columbia was highest at $2,702, Ontario second at $2,355, and Quebec at $2,119. Manitoba and Nova Scotia were virtually tied at $1,679 and $1,680 respectively, with Alberta and Saskatchewan the lowest in the country at $1,410 and $1,128 respectively.
3. Municipal Rental Rates
The chart below presents data on the average rent and the annual change in average rent for all property types in select municipalities in Canada.
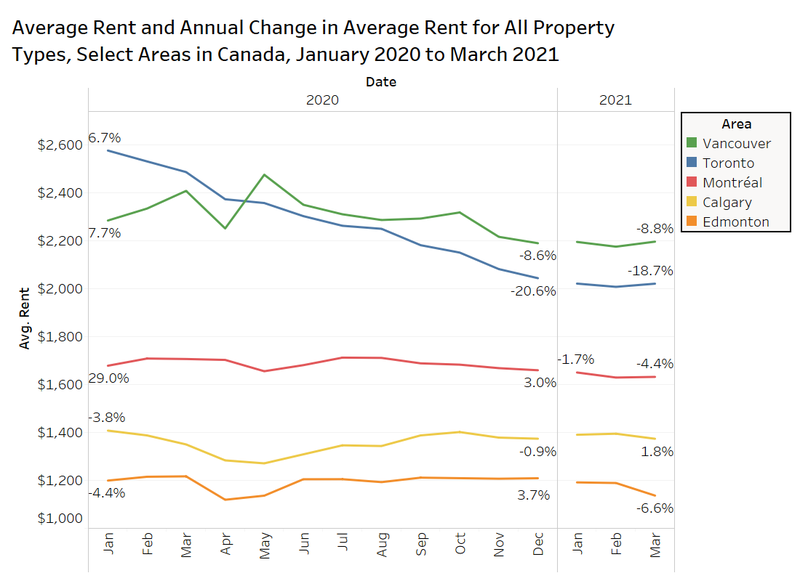 With the exception of Calgary, all of the selected municipalities experienced annual declines in average rent for all property types in March 2021. Toronto had a dramatic decline of 18.7%, the highest of the areas reviewed, followed by Vancouver at 8.8%, Edmonton at 6.6%, and Montreal at 4.4%. Calgary had an increase of 1.8%.
The most notable change in the data from the chart above is the month-over-month increase in rent in Toronto. The former city had seen average rents decline in every month in 2020, as well as January and February of 2021. Montreal’s average rent increased month over month for the first time since July 2020.
The next chart looks at the average rent for traditional rental apartments and condo apartments in March of 2019, 2020 and 2021 for several municipalities and former municipalities in Canada.
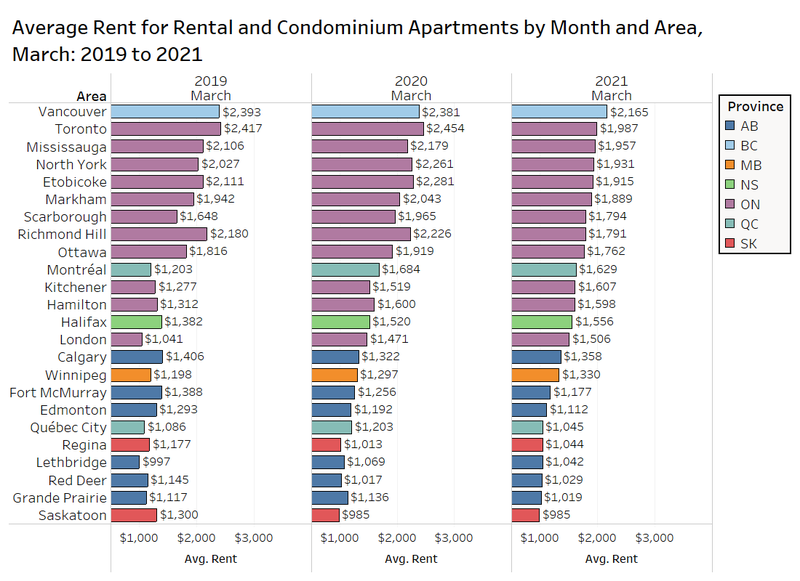 Average rent for rental and condominium apartments ranged from a high of $2,165 in Vancouver to a low of $985 in Saskatoon in March 2021, based on the 24 municipalities and former municipalities with the most listings on Rentals.ca.
The average rent is down by $467 annually to $1,987 in Toronto in March 2021 (-19%), compared to $2,454 in 2020 and $2,417 in 2019. Vancouver rent, at $2,165, was down from $2,381 in March 2020 (-9% annually) and $2,393 in March 2019.
Kitchener, Halifax, London, Calgary, and Winnipeg all had annual increases, while Saskatoon remained the same in comparison to March of 2020.
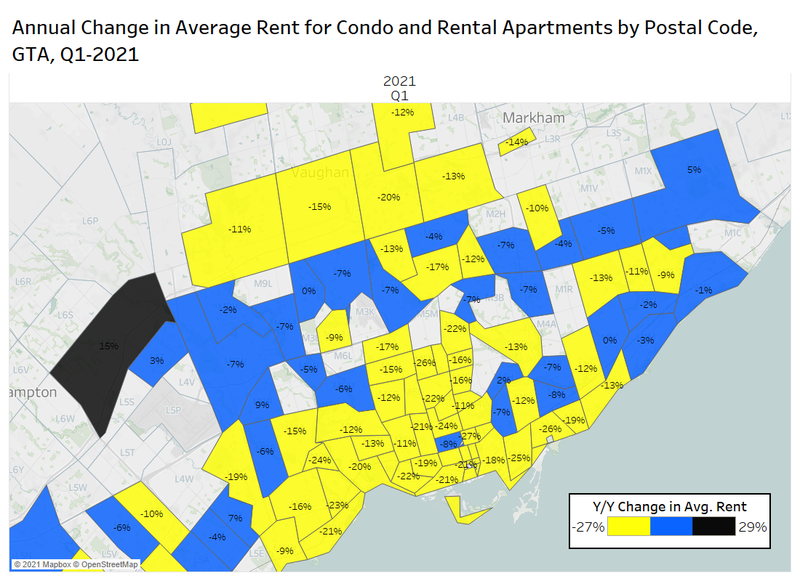
Annual Change in Average Rent by Postal Code in Greater Toronto Area
The chart below looks at the average change in rent for condominium and rental apartments by postal code in the GTA. Only areas with 20 or more listings in Q1-2021 and Q1-2020 were included in the map.
The downtown area has been hit the hardest, with decreases of over 20% to 25% annually in many areas. The “outer-416” area of Toronto, which includes a lot of older apartment stock, has seen annual declines primarily in the range of 2% to 9% annually.
The southern portion of York Region was also hit hard, as this area does not include much older rental stock, but has only newer condo apartments. Vaughan, Richmond Hill and Markham postal codes have seen annual decreases in average rent of 11% to 20%.
 Rent Per Square Foot by Project in Toronto
The figure below shows the average rent per square foot (psf) for condo and rental apartments in the amalgamated City of Toronto by project. Projects with at least 20 listings in 2019, 2020 and Q1-2021 were included in the table.
The colour of the marker reflects the former municipality, the size of the marker indicates the average unit size, and the shape of the marker reflects the property type.
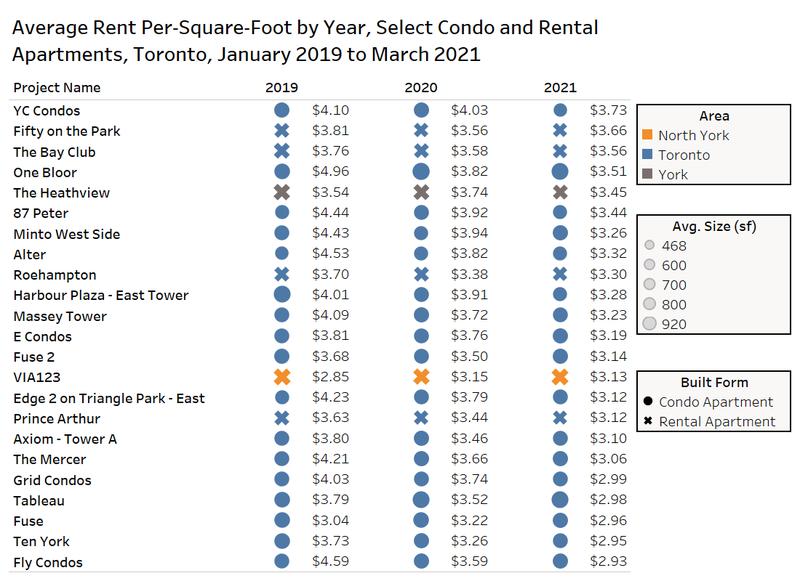 The most expensive condo project is YC Condos at $3.73 psf at 7 Grenville Street in downtown Toronto, followed closely by the rental apartment Fifty on the Park at $3.66 psf (50 Portland Street) and The Bay Club at $3.56 psf (925 Bay Street).
The Heathview in York has an average rent psf of $3.45 near St. Clair and Bathurst, and VIA123 in North York is at $3.13 psf (123 Parkway Forest Drive).
The projects with the largest annual decline in average rent per square foot were Grid Condos, Fly Condos, and Edge 2 on Triangle Park – East. Grid Condos at 1818 Dundas Street East experienced the largest annual decline, decreasing 20.3% from $3.74 psf down to $2.99 psf. The average rent psf at Fly Condos (352 Front Street W) experienced an annual decline of 18.6%, moving from $3.59 psf in Q1-2020 down to $2.93 psf in Q1-2021. Edge 2 on Triangle Park (36 Lisgar Street) saw its average rent psf decrease 17.7%, moving from $3.79 psf in Q1-2020 down to $3.12 psf in the first quarter of 2021.
4. Conclusion
The average rental rate for all property types in Canada in March was down from February, and down 8.5% annually as the pandemic has continued to take a bite out of the rental market on a national level.
Most of the charts and tables focused on the annual changes and comparisons at the one-year mark of the global pandemic.
There were some signs that the rental market might have bottomed out, as the average rent in Vancouver, Toronto and Montreal increased in March over February this year.
As many places in Canada continue to be locked down and schools stay closed, many tenants are focusing on leasing larger units, which are more attainable due to the decline in rents, and the reduced demand without immigration. Secondly, lower interest rates and changing priorities have increased demand for home ownership.
These shifts in market sentiment and preferences have changed the composition of units for lease on Rentals.ca, impacting the cumulative data in this report. More smaller units for rent have pulled the average rent down, but these smaller units have higher rent on a per-square-foot basis, which has resulted in higher per-foot rent levels.
Median rent levels by bedroom type show that studios, two-bedroom, three-bedroom and four-bedroom properties have all increased year over year, suggesting that outliers have had a big impact on the averages, and the market might not be as bad as some of the data in this report suggests due to these compositional shifts.
Anecdotal evidence from leasing agents suggests that rental demand is increasing in the downtown areas of Canada’s major cities, as tenants look to get in at the bottom before rents rise in conjunction with the rise in vaccine distribution.
Bullpen Research & Consulting and Rentals.ca will continue to monitor the data, and break down the figures in multiple ways to better understand the trends in future reports.
Rentals.ca Data
The data used in this analysis is based on monthly listings from Rentals.ca. The data is much different than the more familiar numbers collected and published by Canada Mortgage Housing Corporation (CMHC).
Rentals.ca data includes basement apartments, rental apartments, condominium apartments, townhouses, semi-detached houses and single-detached houses, where CMHC’s primary rental data only includes rental apartments and rental townhouses. CMHC collects some data on the secondary market, but it is reported separately.
The CMHC rental rates are based on the entire universe of purpose-built rental units in Canada (the stock), while Rentals.ca data is primarily based on the asking rents of vacated units only (the flow) — this is a smaller sample size, but more representative of the actual market rent a prospective tenant encounters. The Rentals.ca data set typically produces much higher rental rates in comparison to CMHC, as vacated units are not subject to rent control.
The average and median rental rates via Rentals.ca can also skew higher than CMHC’s data for several reasons: The inclusion of larger and more expensive unit types like singles, row units and condos; the survivorship bias (overpriced units remain in the sample longer); and the multiple listings of the same property at different rent levels every month.
It should also be noted that properties listed for above $5,000 a month and below $500 a month are eliminated from the sample of units analyzed. Also, short-term leases, single-room rentals, and furnished rental units are eliminated from the sample where identifiable.

Rentals.ca is Canada’s premier online marketplace for renters and landlords, providing a comprehensive suite of tools and resources tailored to simplify the rental process. With an extensive selection of listings across the country, Rentals.ca offers user-friendly search functionality that helps renters find their perfect home efficiently. For landlords, Rentals.ca delivers effective advertising solutions to maximize visibility and fill vacancies faster. Committed to innovation and excellence, Rentals.ca aims to empower users with up-to-date market insights and expert guidance, making renting easier and more accessible for everyone.