
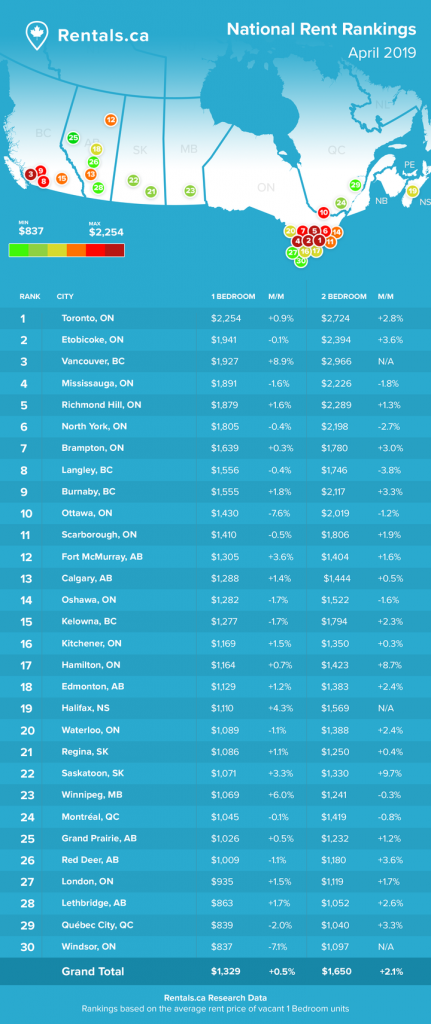
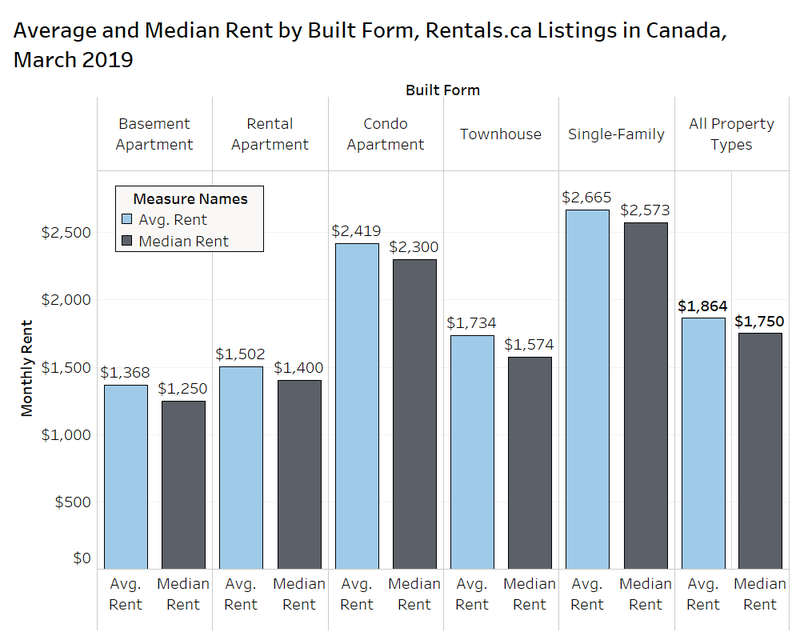
The average property on Rentals.ca was offered for $1,864 per month in March, a decrease of 1.3% month over month. The median asking rent in March of $1,750 per month is 2.7% lower than February ($1,800).
National Overview
Basement apartments and townhouses were more expensive to rent in March compared to a month earlier, rental apartments were virtually unchanged, but single-family properties (single-detached and semi-detached houses) and condominium apartments were less expensive on average in Canada.
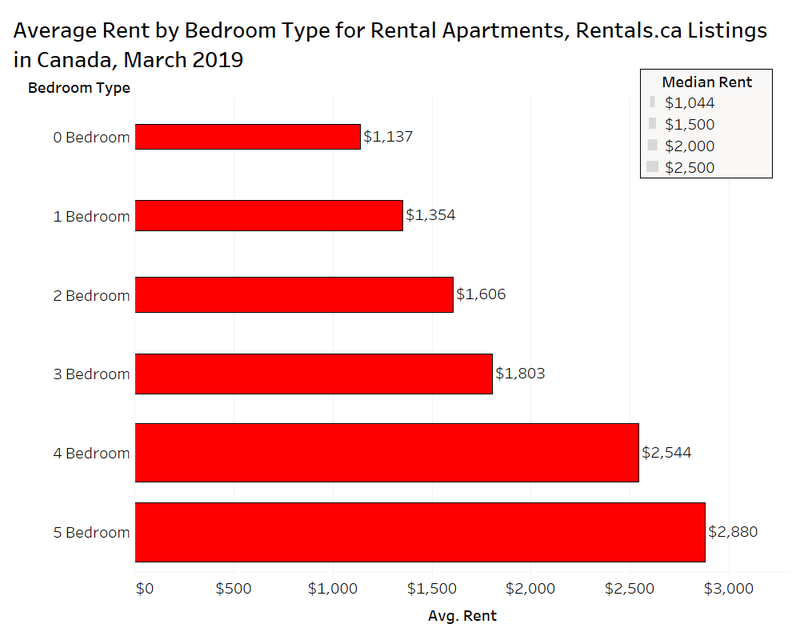
The bulk of the listings on Rentals.ca are rental apartments, and removing other property types can eliminate some of the noise that contributes to the monthly volatility in the data.
The chart below shows the average rental rates for rental apartments by bedroom type in Canada in March (the thickness of the bars represents the median rental rates). Studios were offered for rent at $1,137 per month on average nationally, compared to $1,354 for a one-bedroom unit and $1,606 for a two-bedroom unit. Studios and one-bedroom units were less expensive in March compared to a month earlier, while two-bedroom units were more expensive.
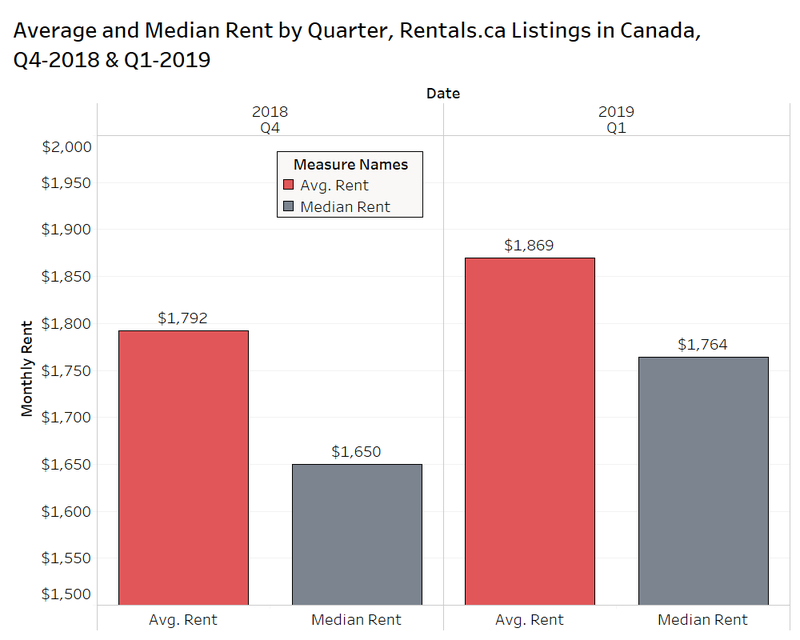
Given the fluctuations that can occur with monthly readings, this Rentals.ca National Rent Report will also look at the quarterly data to smooth out the “lumps” in the results with a larger 3-month sample size.
The average property listed on Rentals.ca in the first quarter of 2019 was offered for $1,869 per month, an increase of 4.3% over Q4-2018. The median rental rate was $1,764 per month, which represents a more significant jump of 6.9% quarter-over-quarter.
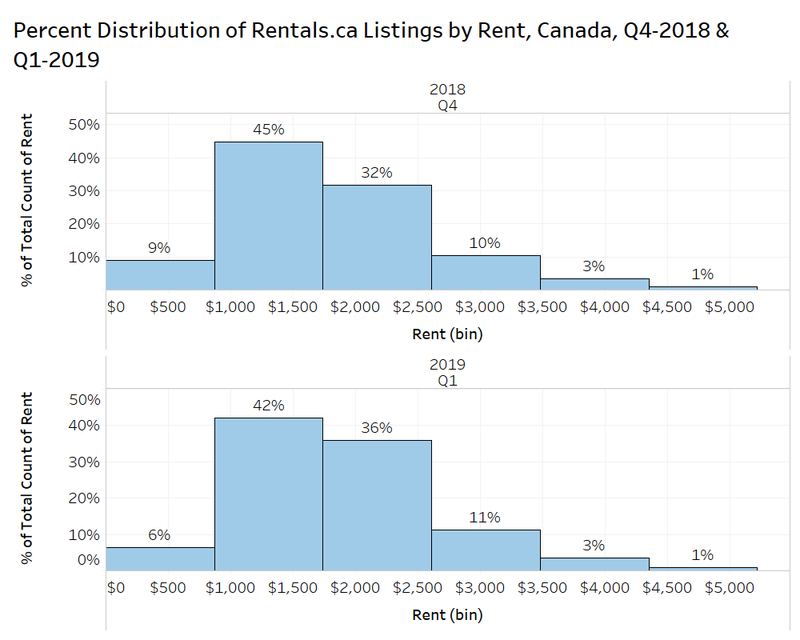
To get a sense of what accounted for the rent changes on a quarterly basis, we can look at a percent distribution of the rents by quarter.
The share of affordable rentals, essentially units listed for under $1,000 a month is the first ‘rent bin’. This first rent bin declined from 9% of listings in Q4-2018 to 6% of listings in Q1-2019. The share of higher-end rentals above $2,500 month stayed relatively constant quarter on quarter, at about 14% of Canadian listings (it should be noted that units listed above $5,000 per month are eliminated from the sample).
The biggest change occurred in the bin that ranges from about $1,750 to $2,500 a month, with the market share rising from 32% of total listings in the fourth quarter of last year to 36% in Q1-2019.
Another factor to consider when looking at changes in average rents is how the composition of the units changed. Not all of the Rentals.ca listings have their unit sizes listed, but the sample is large enough to create a reasonable representation of the total.
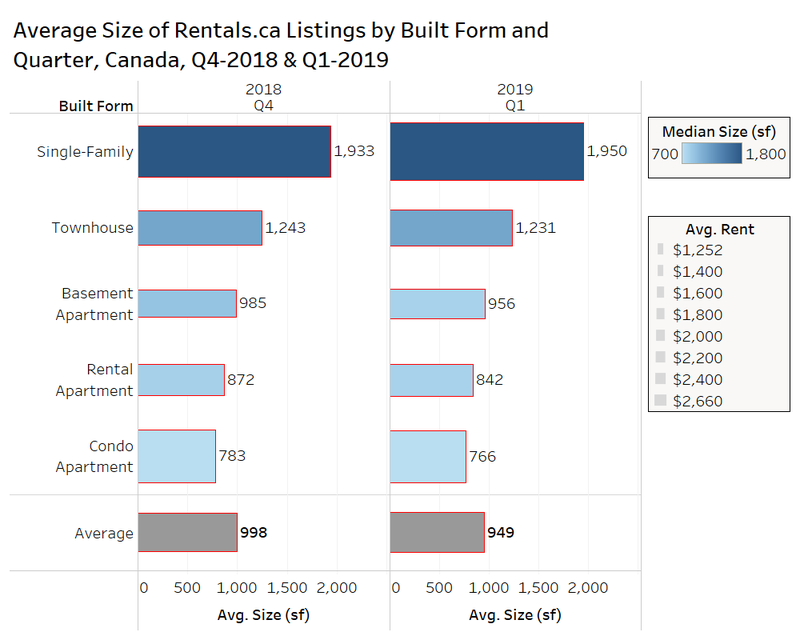
The average rental rates in Canada went up quarterly, despite the fact that the average unit size decreased for four of the five property types. The average unit listed in Q1-2019 on Rentals.ca was 949 square feet, nearly 5% smaller than the 998-square-foot average unit listing in Q4-2018.
The chart below shows the average sizes by built form, with the shading of the bars indicating the median unit size, and the thickness of the bars indicating the average rental rate. Condominium apartments had the smallest average unit size in Q1-2019 at 766 square feet, 2% smaller than in the fourth quarter — keep in mind that the bulk of these listings are in Metro Toronto Area, where the Canada Mortgage and Housing Corporation (CMHC) has estimated that approximately 130,000 condo apartments are leased out by investors.
Provincial Rental Rates
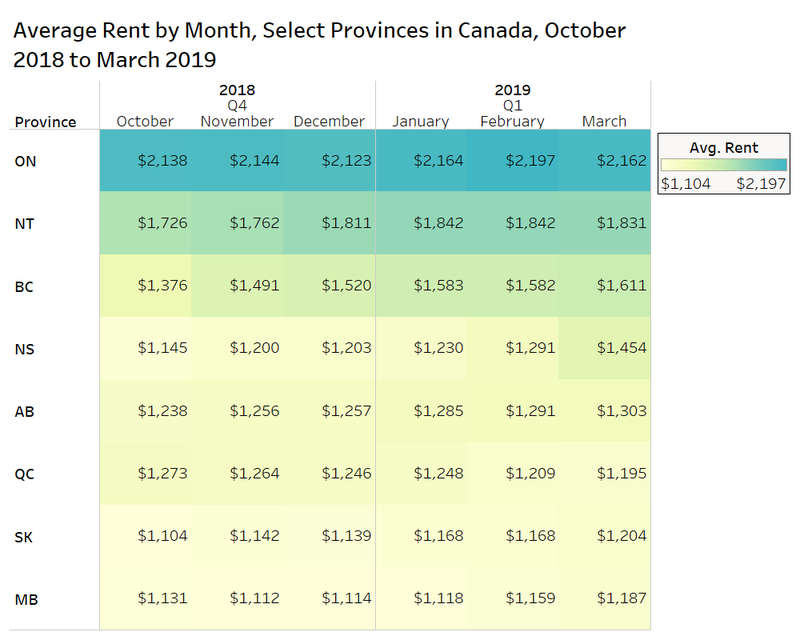
On a provincial level, Ontario had the highest rental rates in March, with landlords seeking $2,162 per month on average (all property types), a decrease of 1.6% from February ($2,197). In British Columbia, the average asking rent was $1,611 per month, an increase of 1.8% month over month. Asking rents in Alberta have increased in each of the last five months, with March’s $1,303 average rent increasing by nearly 1% over February.
Comparing average rents across provinces can be tricky given the differing rental product offered in each province. The chart below looks at the range of rental offerings by size and rental rate, looking at the 10th and 90th percentiles to eliminate outliers. Median monthly rent values are also shown.
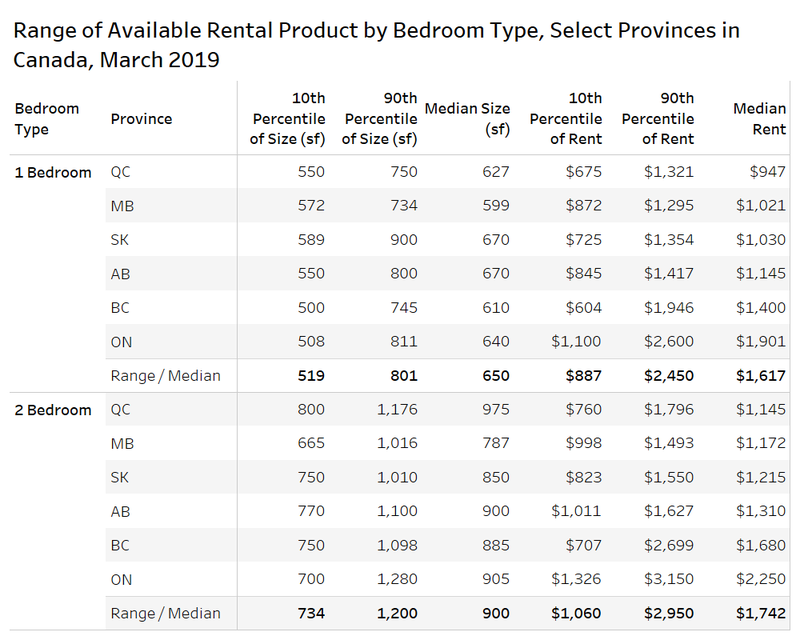
The smallest rental units are in Manitoba, with 599-square-foot median one-bedroom units and 787-square-foot median two-bedroom units.
Quebec offers relatively small one-bedroom units, but large two-bedroom units, while Saskatchewan is the opposite, offering larger one-bedroom units and smaller two-bedroom units.
The median rent for a one-bedroom unit in Ontario is $500 more than in British Columbia.
The median rent for a one-bedroom unit is about $125 a month less than a two-bedroom unit across these select provinces.
Municipal Rental Rates
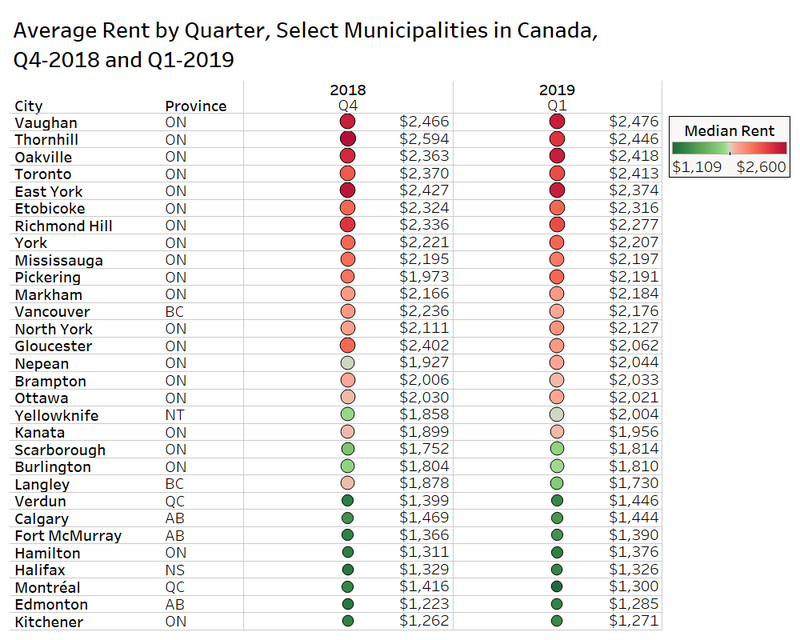
The chart below shows how average rental rates have changed in various municipalities in Canada on a quarter-over-quarter basis.
Looking at the major cities shows that average rents in Toronto increased by 1.8% in Q1-2019 over Q4-2018. Vancouver rents were down 2.7% and Ottawa declined 0.5% — however the median rent in Ottawa increased by 2.6%.
In Alberta, Calgary rental properties were down 1.7% quarterly, but Fort McMurrary was up 1.7%, and Edmonton rentals was up 5.1%.
Halifax Rental Market
The map below shows the average rent by postal code in Halifax and Dartmouth using listing data from Rentals.ca over the past six months.
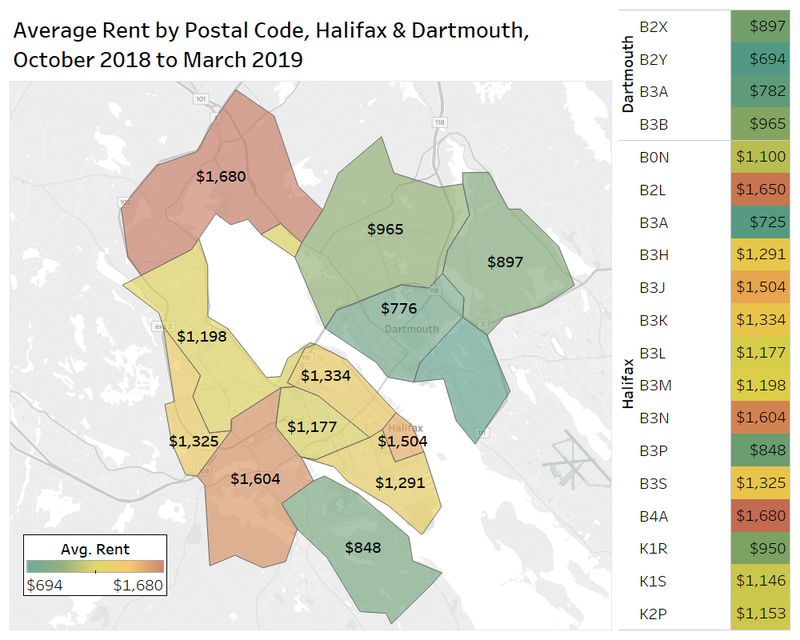
Many of the postal codes have relatively small sample sizes, but areas like B2X and B3A in Dartmouth have had a number of Dartmouth rentals listed on Rentals.ca since October 2018 at under $900 on average (B2X). and under $800 on average (B3A).
The three postal codes with the most listing activity in Halifax are B3H in the south end ($1,291 per month on average), B3K in the north end ($1,334), and B3J downtown ($1,504).
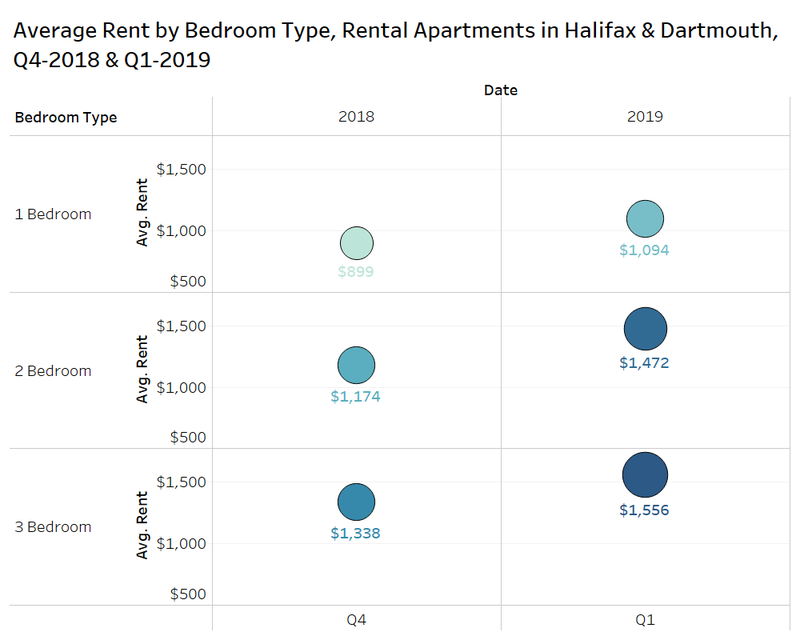
Almost all of the listing activity is for Halifax apartments, and the data suggests that rental rates in Halifax are increasing. Average rents for one-bedroom, two-bedroom and three-bedroom apartments have all increased quarter-over-quarter by more than 15%, but it is likely that the changing composition of listings accounts for some of that rise (larger units listed in the first quarter), as opposed to a significant increase in demand.
However, Rentals.ca did see a noticeable jump in user activity in the first quarter of 2019 in Halifax, with a 34% increase in pageviews, and because the number of listings in Halifax declined, a 164% increase in pageviews per listing.
Toronto Insights
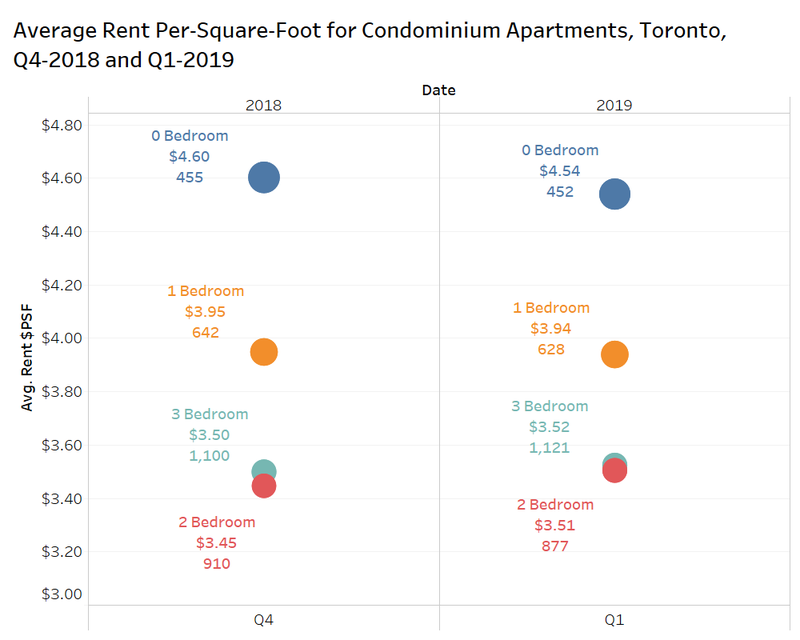
Toronto has the most active market in Canada for private landlords, as investors purchase pre-construction condominium apartments and rent them out at completion. Despite the record number of condominium units under construction, the number of condos completed in Toronto last year was not enough to keep up with demand, especially since the new mortgage stress test limited credit for many first-time buyers (and move-up buyers that didn’t list their less expensive properties for first-time buyers to purchase). References to Toronto in this report reflect the former City of Toronto boundaries, pre-amalgamation.
Rents rose rapidly in 2018, but have started to cool down in the first quarter of 2019. Studio condos were being listed at $4.54 per-square-foot in the first quarter for 452 square feet on average, a decrease of 1.3%. Rents per-foot are virtually unchanged for one-bedroom units at about $3.95 per-square-foot, while two-bedroom units rent increased by 1.7% quarterly to $3.51 per-square-foot for 877 square feet on average.
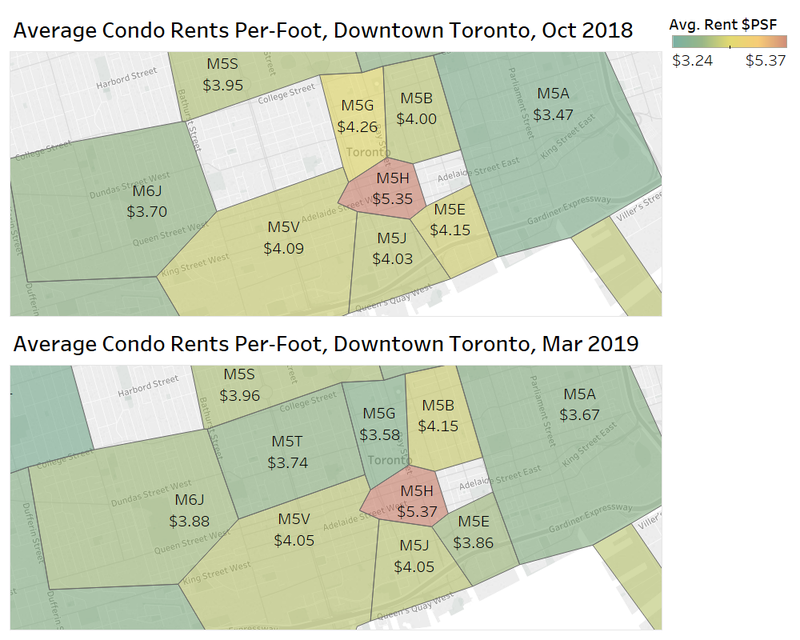
The bulk of the condo rental activity is happening in downtown Toronto, and the maps below look at the average asking rent per-square-foot in October 2018 versus March 2019 by postal code.
The most active postal code by a significant margin in M5V (Entertainment District rentals), which actually saw a slight decline in rental rates per-foot from October to March from $4.09 per-square-foot to $4.05 per-square-foot.
The second most active postal code is M5A (the downtown east), which saw rents increase by nearly 6% from October to March to $3.67 per-square-foot.
The third most active area is M5J (the south core), where rents increased by just under 1% from October to March, rising from $4.03 per-square-foot to $4.05 per-square-foot.
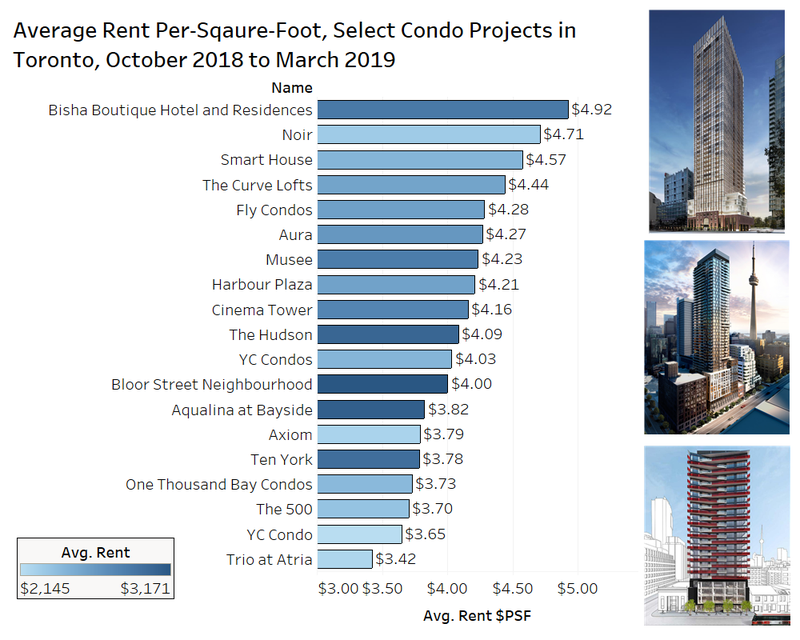
Four of the most active condo projects on Rentals.ca over the past six months are in M5V, with the top three pictured in the chart below: Bisha Hotel & Residences had units listed at $4.92 per-square-foot on average, Noir (87 Peter) has units listed at $4.71 per-square-foot on average, and Smart House had units listed at $4.57 per-square-foot. The per-foot rental rates are high at Noir and Smart House because the units were very small on average at 519 square feet and 518 square feet, respectively. In contrast, the average size at the newly completed Aqualina at Bayside on the waterfront was 856 square feet.
Conclusion
After three straight months of increasing average and median rental rates in Canada, the average monthly rent for Rentals.ca listings declined slightly in March. Mixed economic signals suggests there won’t likely be any interest rate hikes in 2019, and there is a higher chance of a rate reduction, as the potential for a recession has been looming recently. These macro-level worries may be impacting tenants’ propensity to move.
It is likely that many renters will look to take advantage of the First-Time Home Buyers Incentive that was recently announced as part of the budget. This interest-free, down payment assistance program will be capped at $1.25 billion over the next three years, and help many current tenants get into the ownership market. According to CMHC “by helping first-time home buyers purchase homes, we will free up rental supply, easing pressure on rents. This, along with the expanded Rental Construction Financing program, will add to the supply of affordable rental housing.”
These two measures announced in the budget, plus the potential rate cut in 2019 should help ease the upward pressure on rental rates this year nationally, and especially in Toronto where rents continue to increase on a monthly basis.
Rentals.ca Data
The data used in this analysis is based on monthly listings from Rentals.ca. The data is much different than the more familiar numbers collected and published by Canada Mortgage Housing Corporation (CMHC).
Rentals.ca data includes basement apartments, rental apartments, condominium apartments, townhouses, semi-detached houses and single-detached houses, where CMHC’s primary rental data only includes rental apartments and rental townhouses. CMHC does collect some data on the secondary market, but it is reported separately.
The CMHC rental rates are based on the entire universe of purpose-built rental units in Canada (the stock), while Rentals.ca data is primarily based on the asking rents of vacated units only (the flow) — this is more representative of the actual market rent a prospective tenant encounters. The Rentals.ca data set typically produces much higher rental rates in comparison to CMHC, as vacated units are not subject to rent control.
The average and median rental rates via Rentals.ca can also skew higher than CMHC’s data for several reasons: The inclusion of larger and more expensive unit types like singles, row units and condos; the survivorship bias (overpriced units remain in the sample longer); and the multiple listings of the same property at different rent levels every month.
It should also be noted that properties listed for above $5,000 a month and below $500 a month are eliminated from the sample of units analyzed. Also, short term leases, single-room rentals, and furnished rental units are eliminated from the sample where identifiable.

Rentals.ca is Canada’s premier online marketplace for renters and landlords, providing a comprehensive suite of tools and resources tailored to simplify the rental process. With an extensive selection of listings across the country, Rentals.ca offers user-friendly search functionality that helps renters find their perfect home efficiently. For landlords, Rentals.ca delivers effective advertising solutions to maximize visibility and fill vacancies faster. Committed to innovation and excellence, Rentals.ca aims to empower users with up-to-date market insights and expert guidance, making renting easier and more accessible for everyone.