

Rents in Canada Decline to Two-Year Low
National Overview
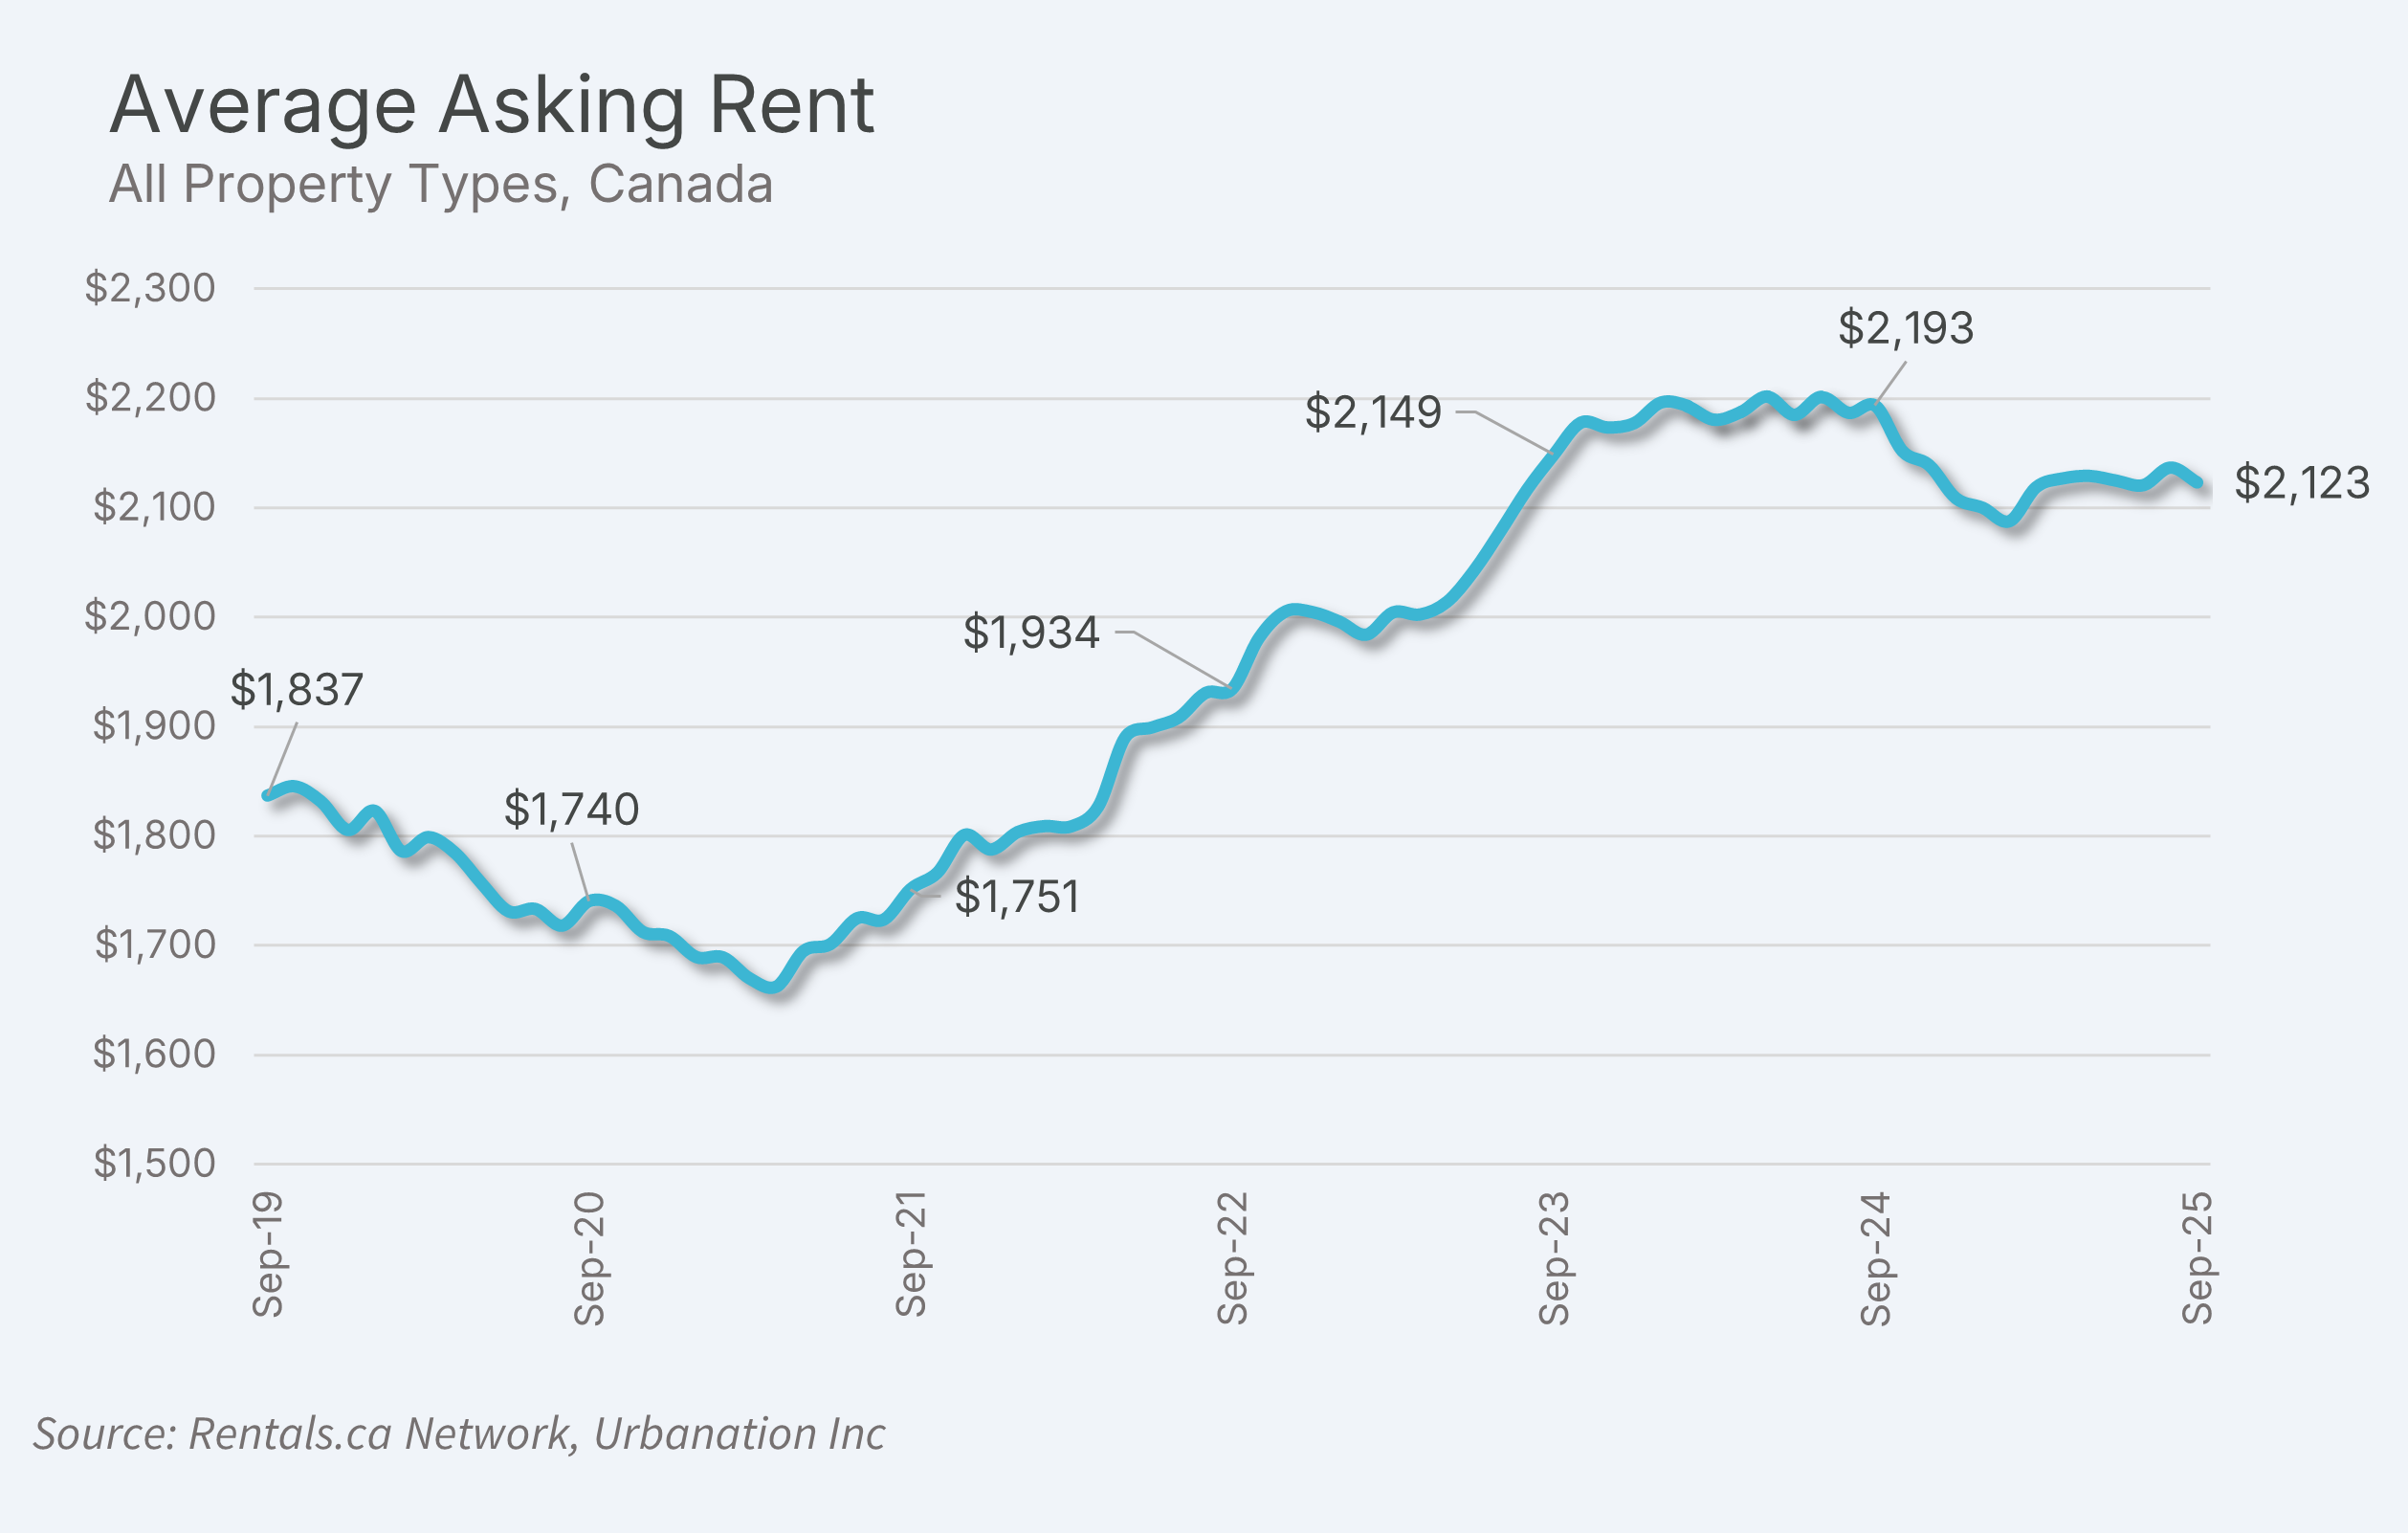
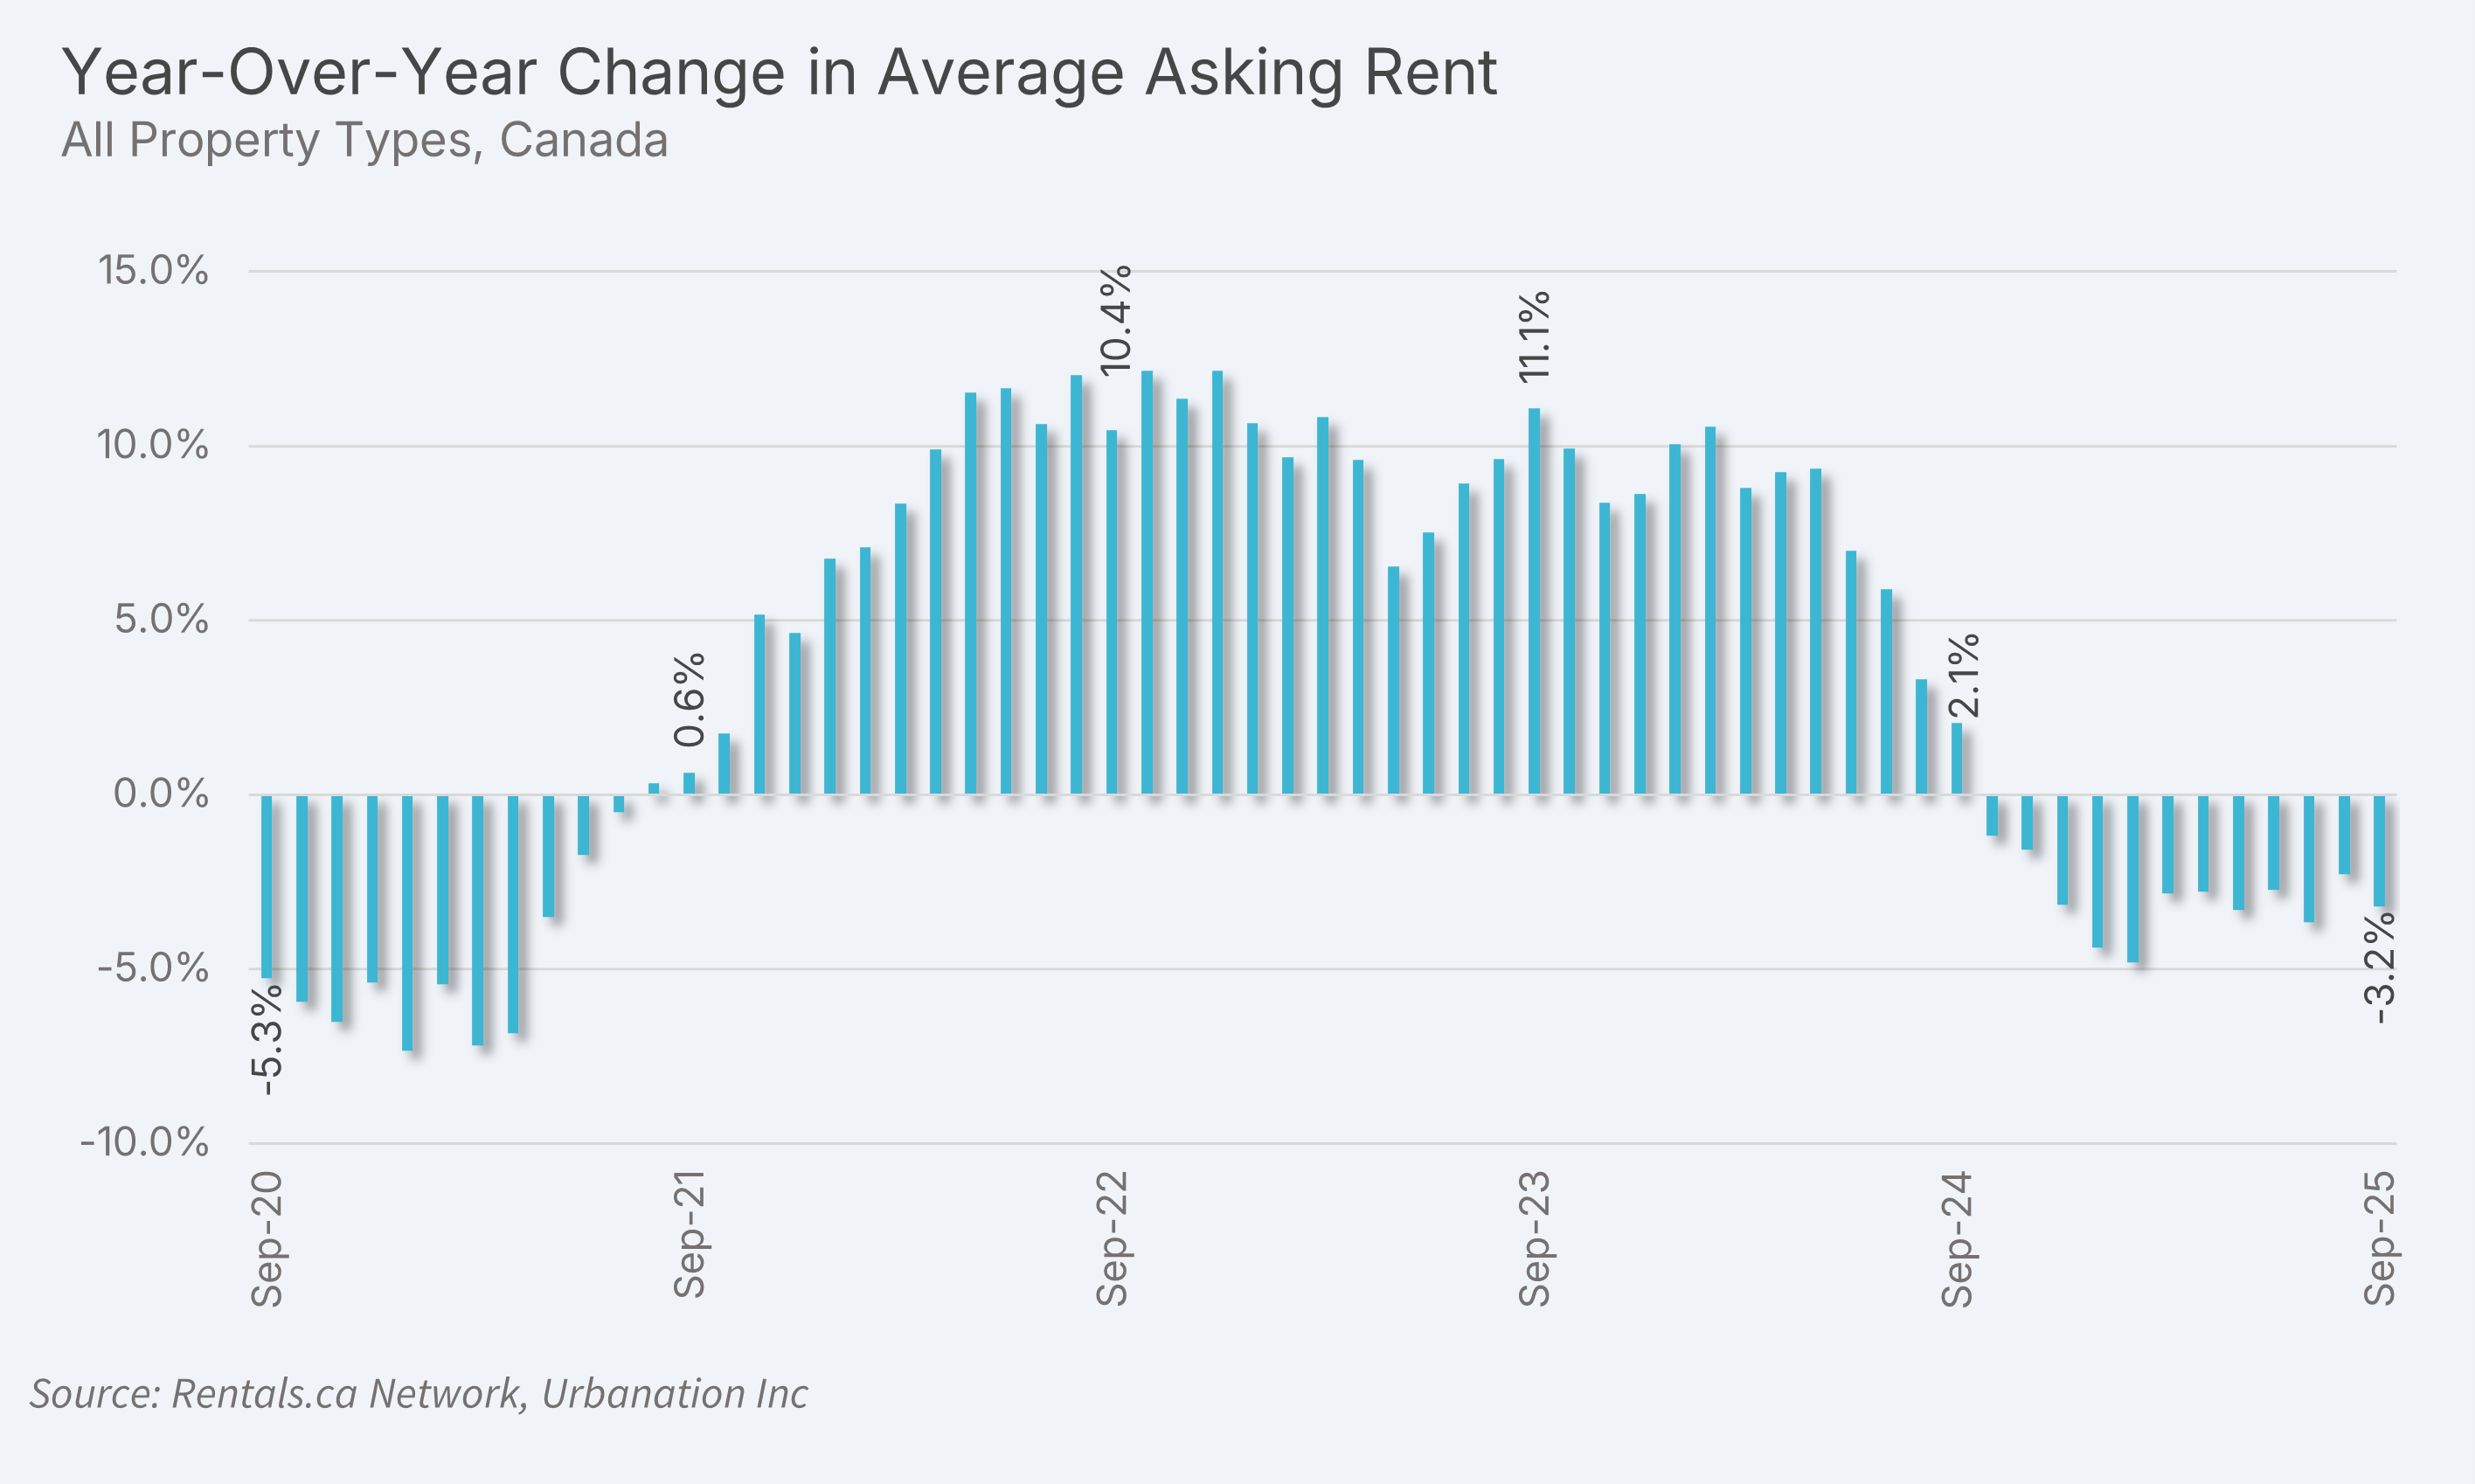
Asking rents in Canada decreased 3.2% in September from last year’s record high to an average of $2,123, marking the twelfth consecutive month of year-over-year declines. This followed 38 consecutive months of rent increases between August 2021 and September 2024 and 15 consecutive months of rent decreases between May 2020 and July 2021 during COVID-19.
The latest rent declines have coincided with record high apartment completions, population decreases for non-permanent residents, and a weakening job market.
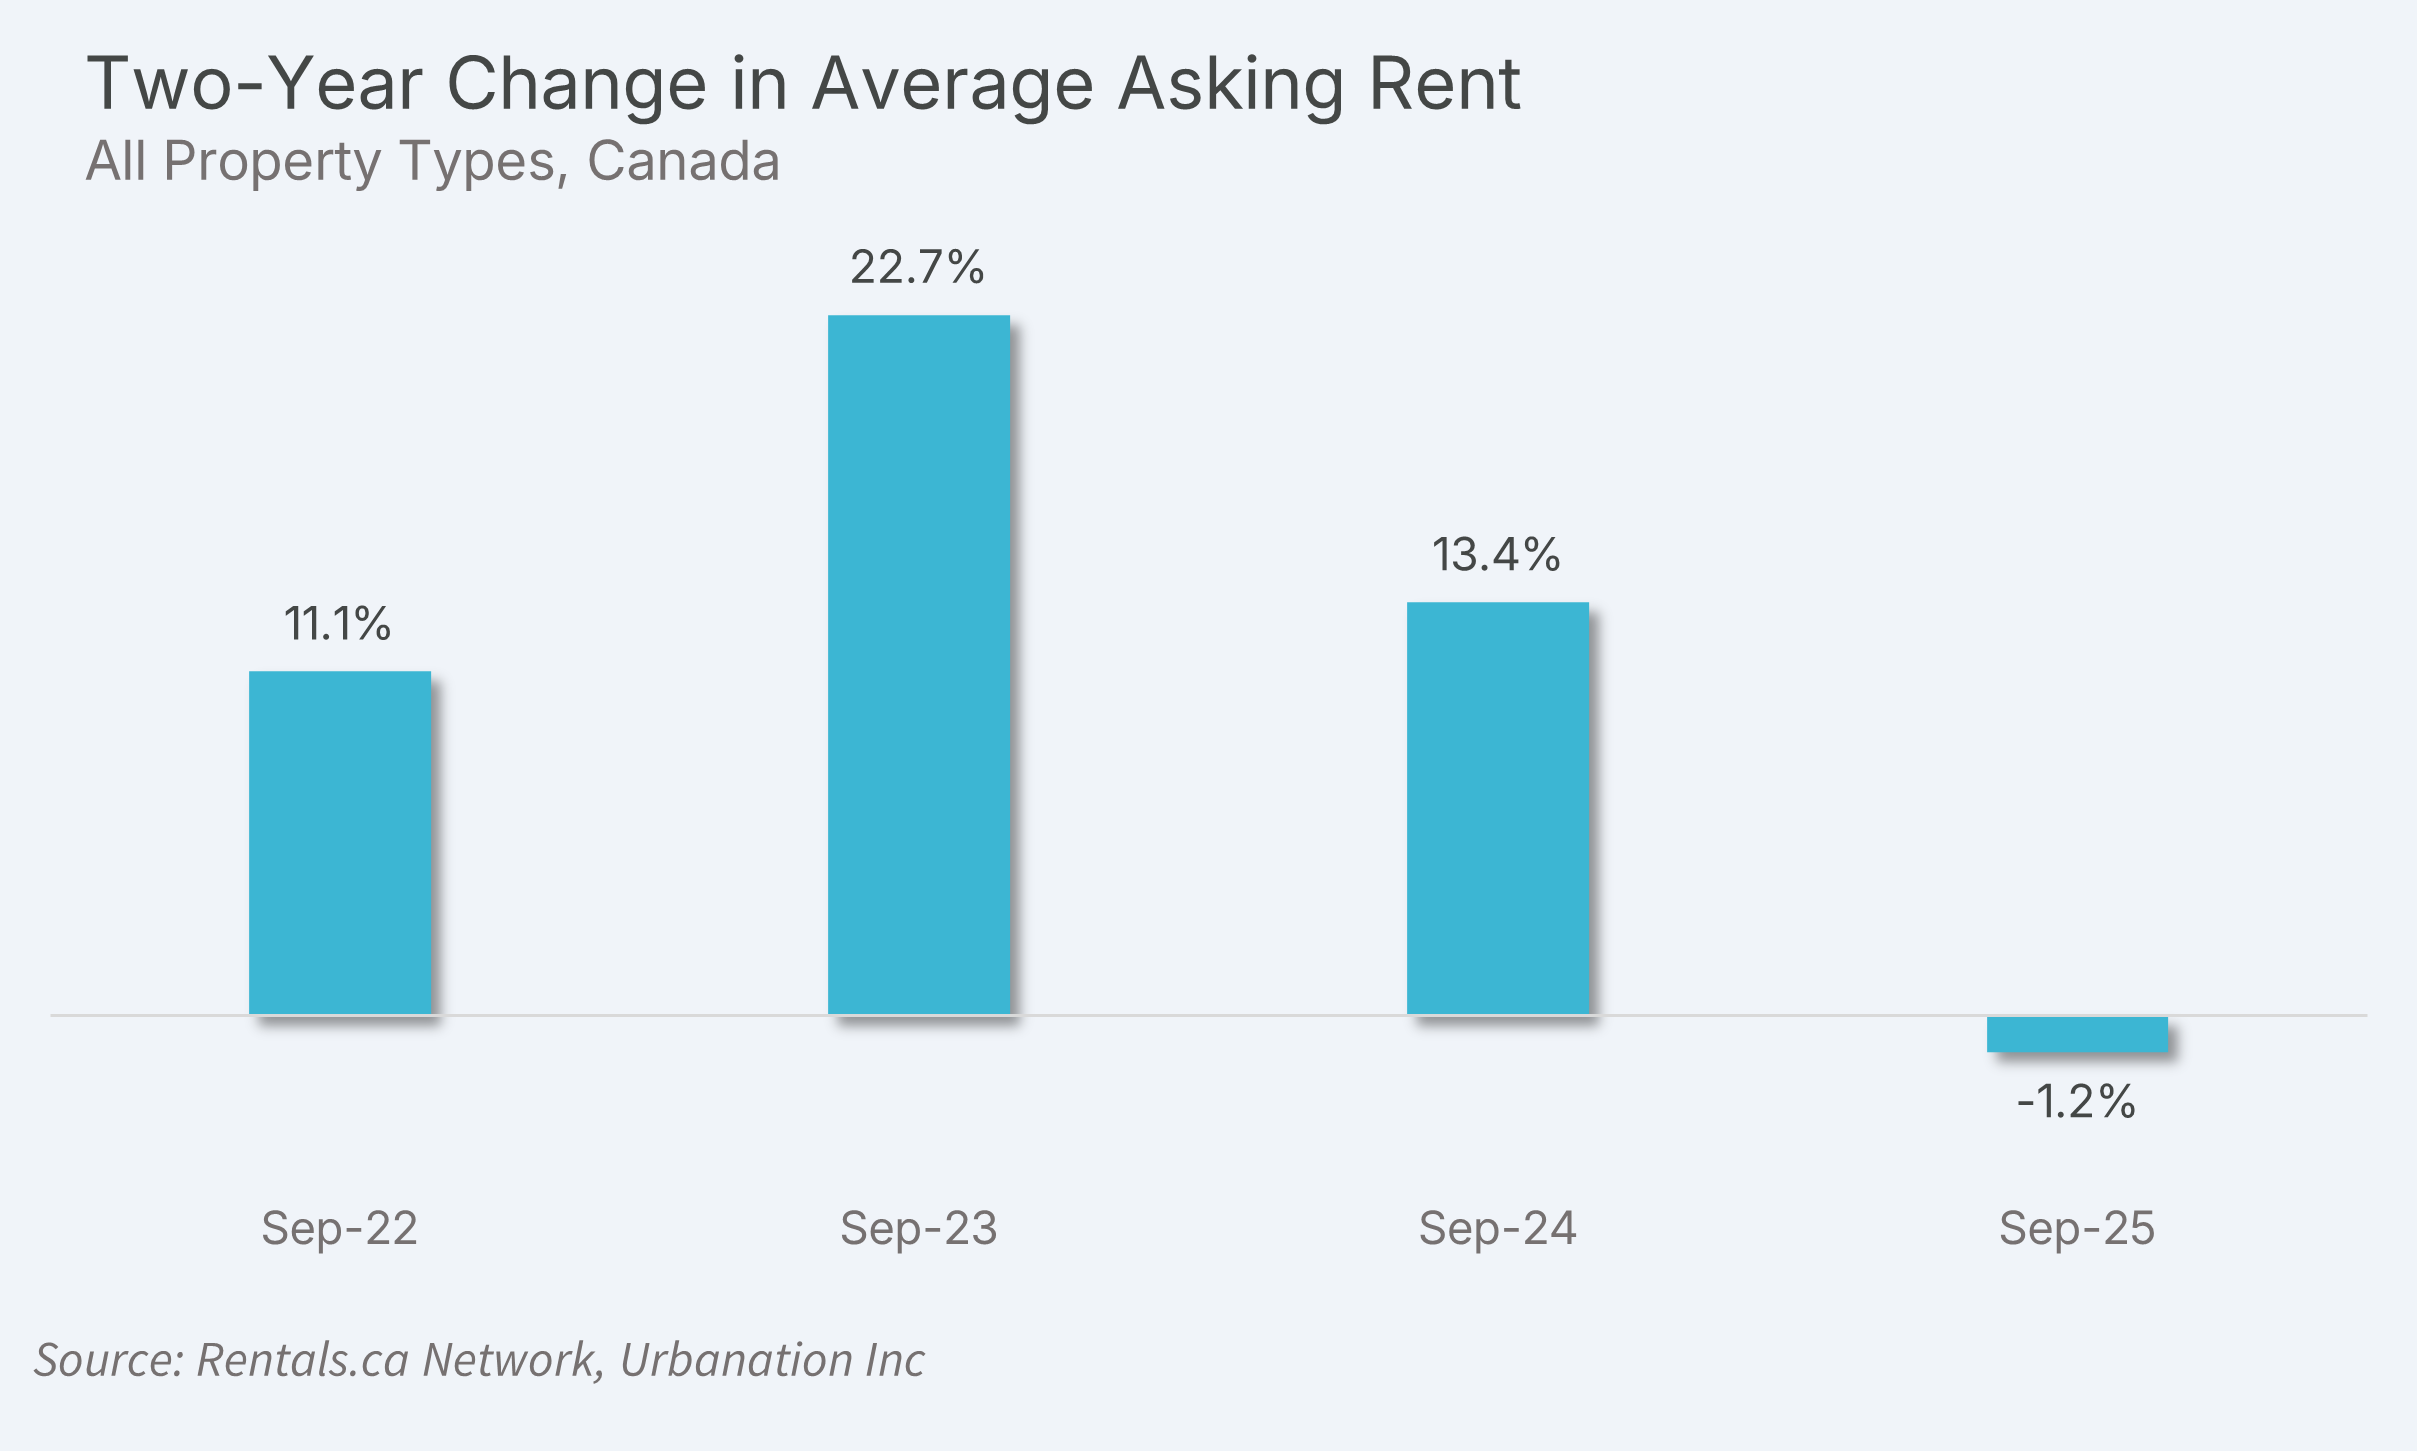
Rents were down 1.2% from two years ago, registering the first two-year decline since January 2022.
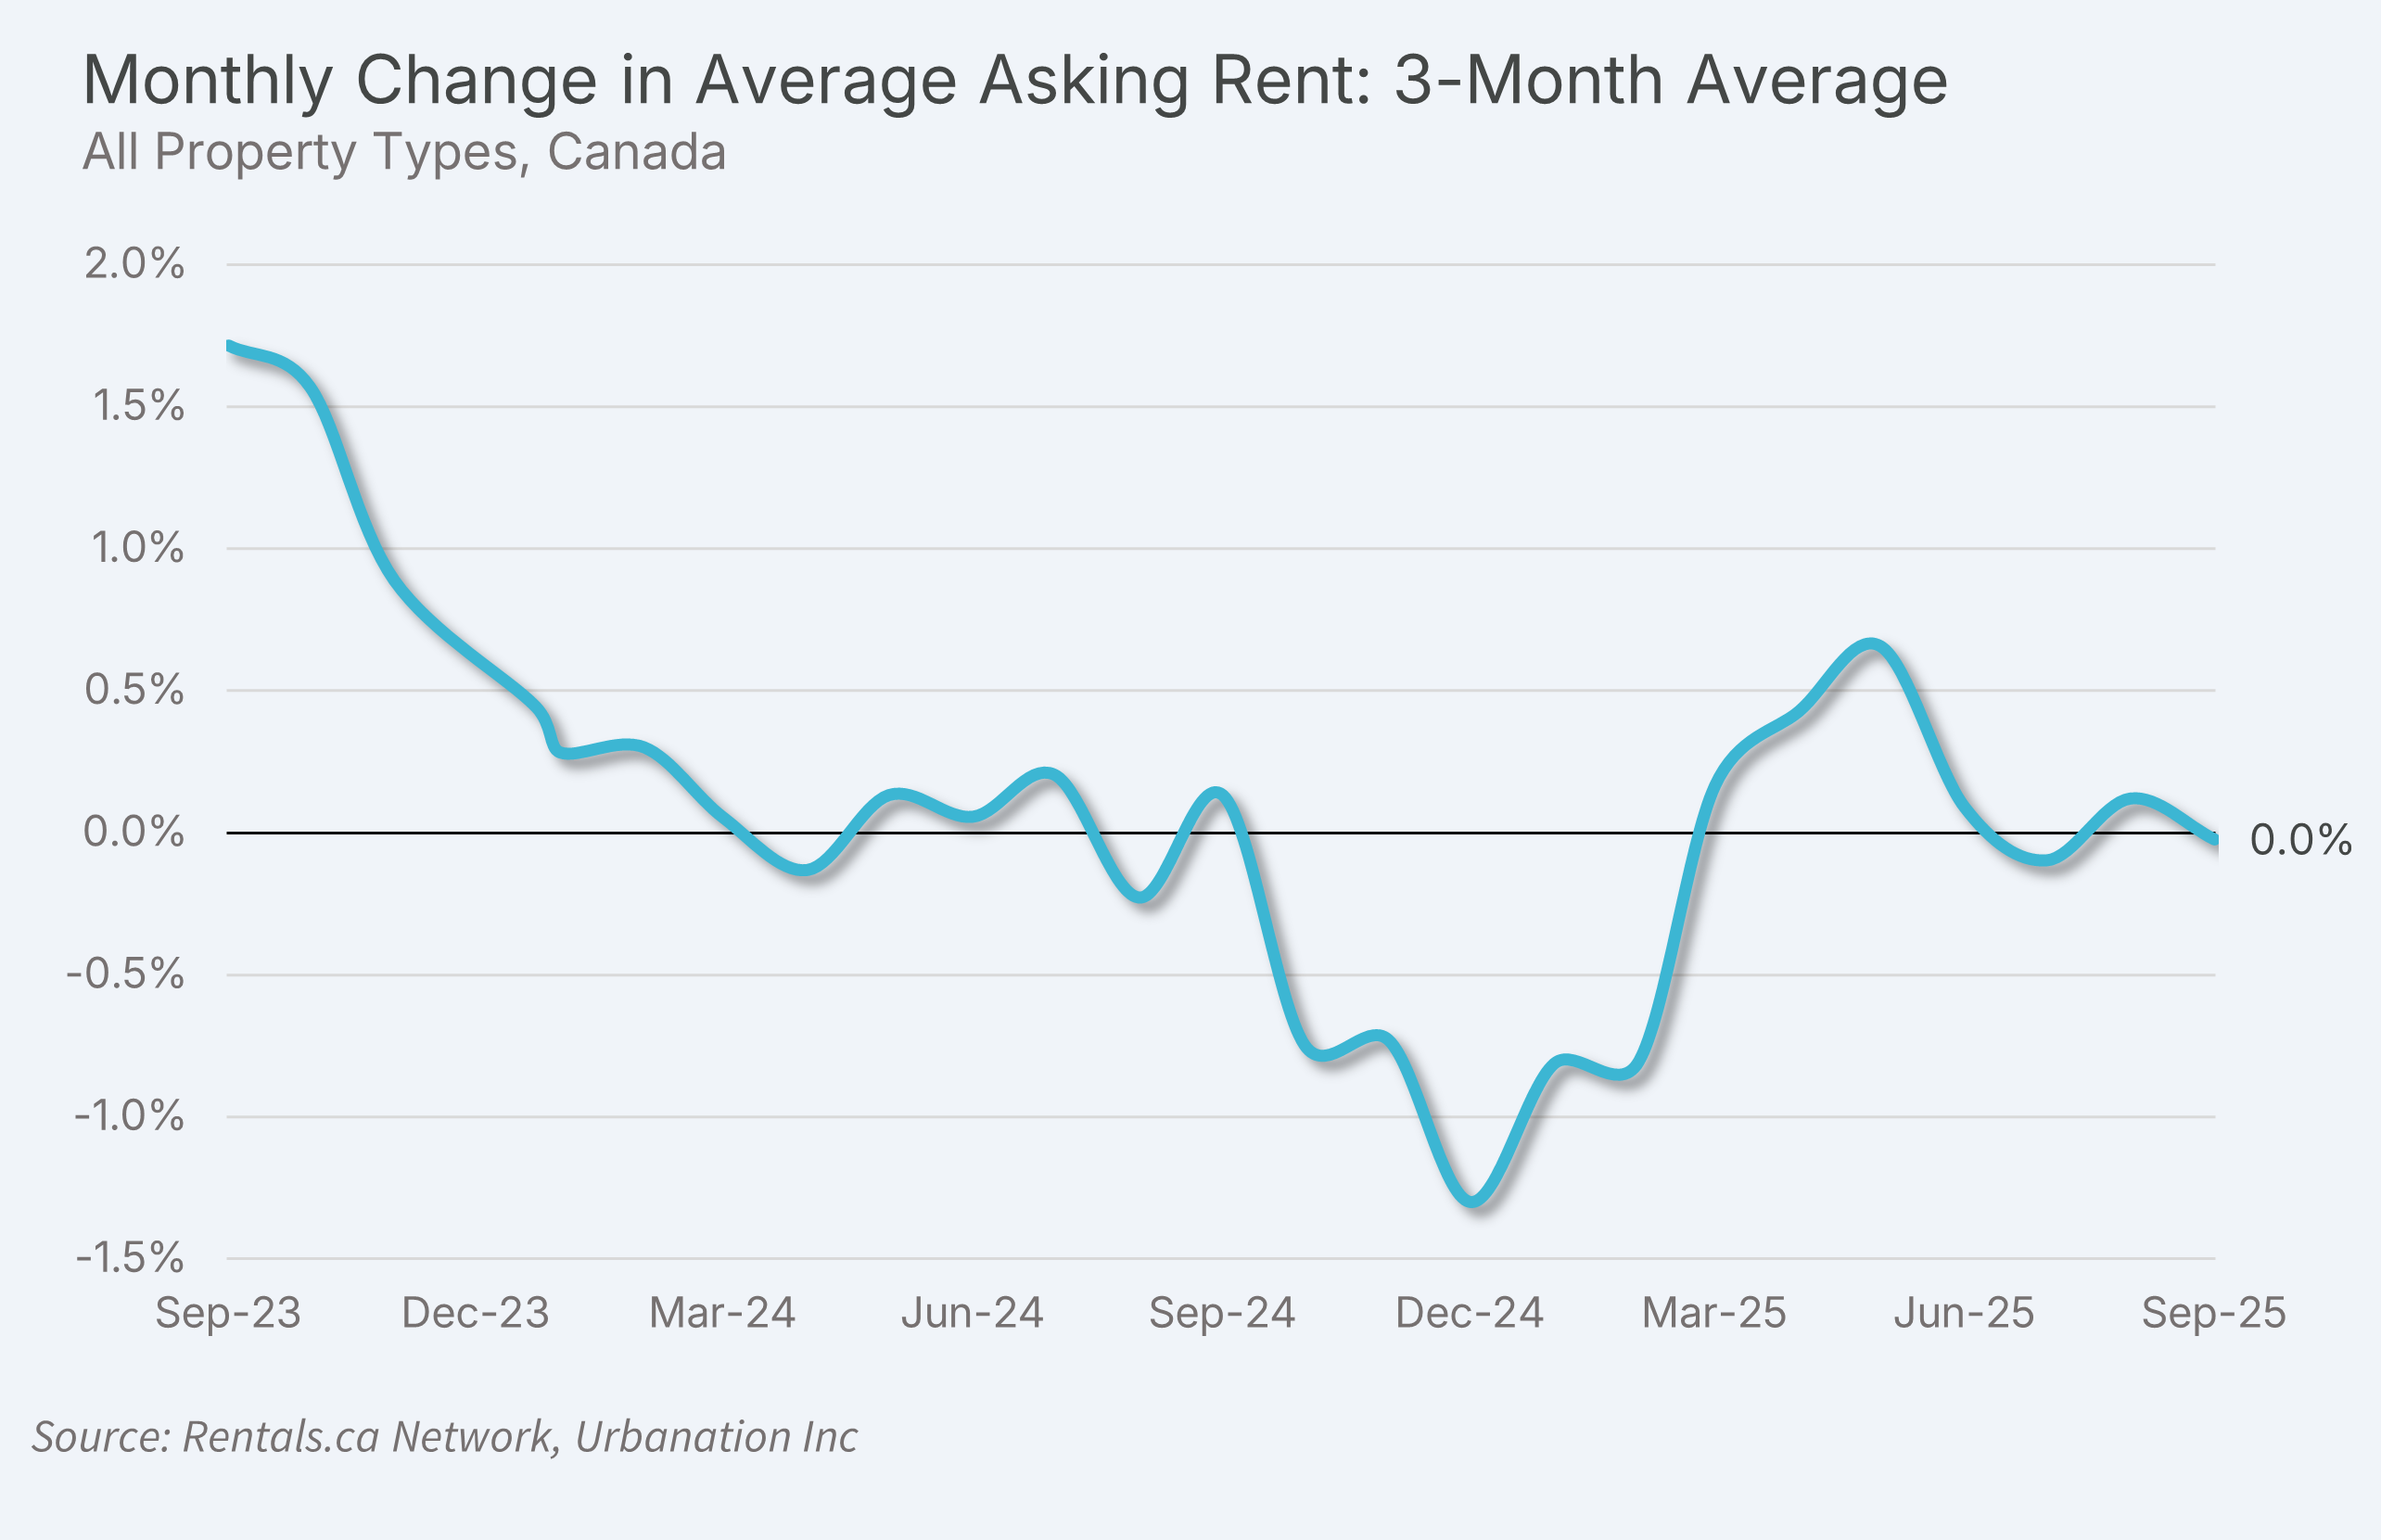
Despite rents having adjusted lower from highs reached over the previous two years, the monthly trend has shown stability, with the three-month moving average staying flat in September.
Secondary Market Units Continue to Lead Rent Declines
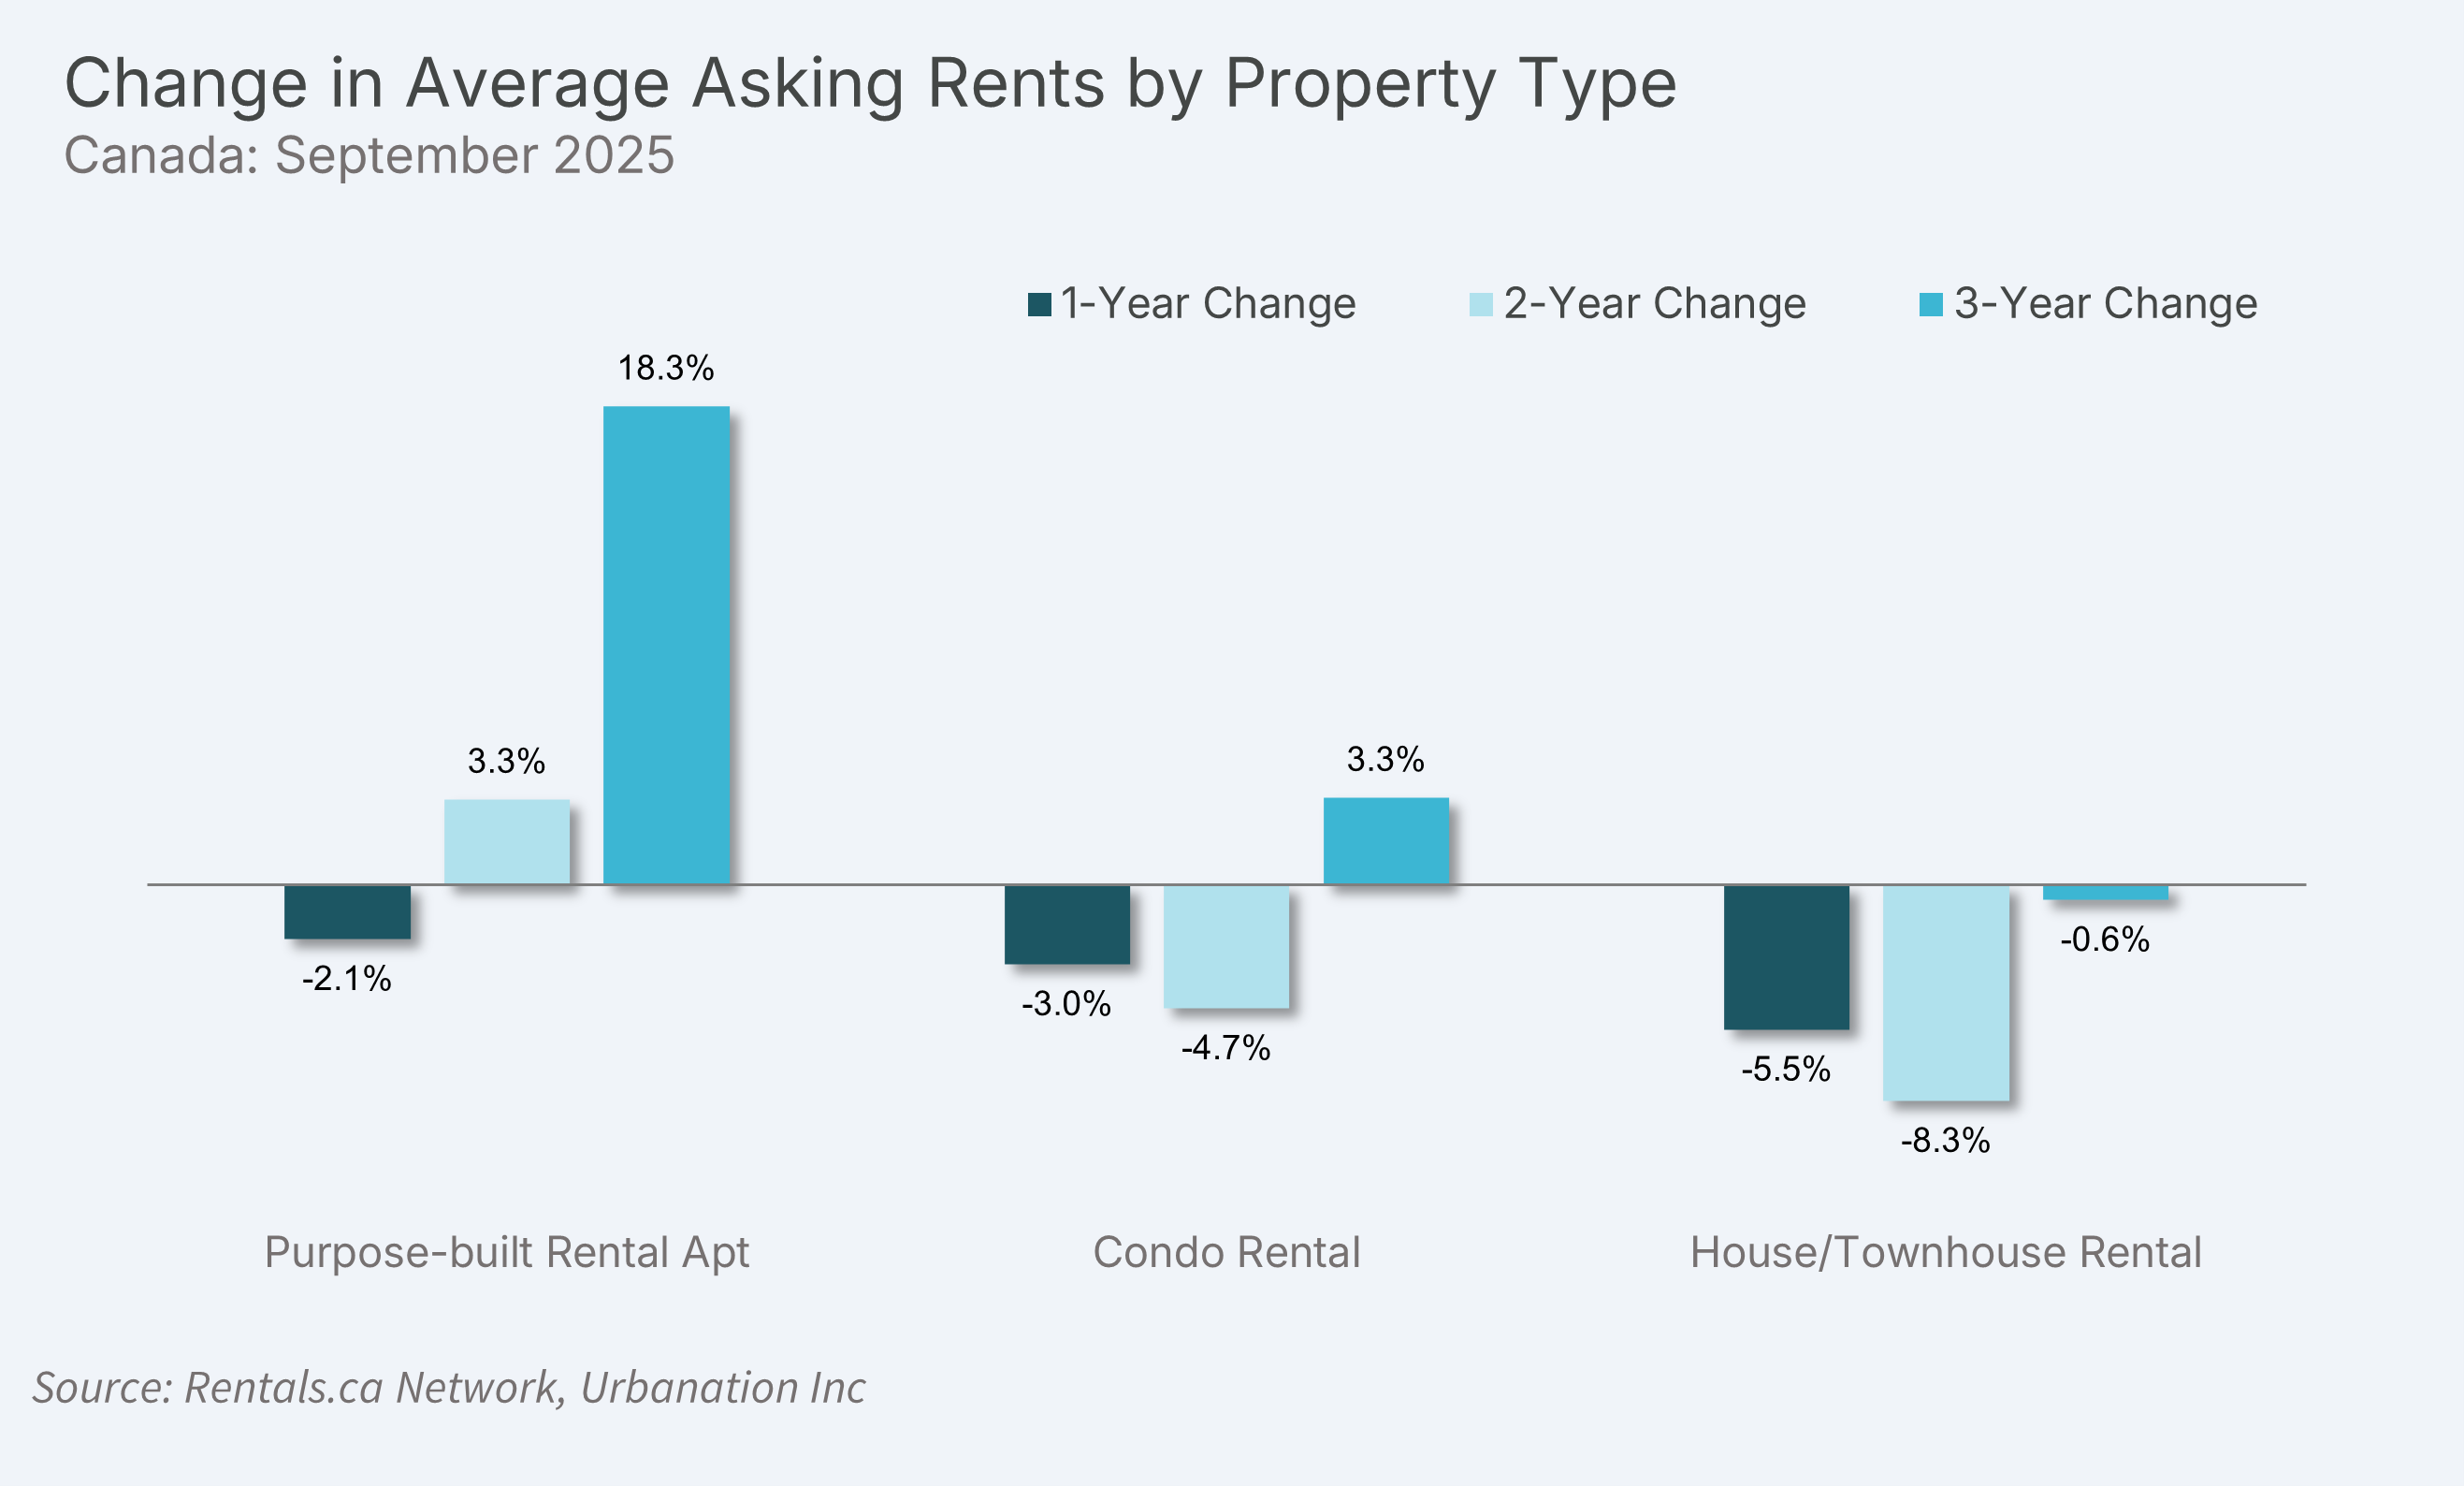
Rents declined across all property types during the past year, with a 2.1% decrease in purpose-built rents to an average of $2,093, a 3.0% decrease in condo rents to an average of $2,226, and a 5.5% decrease in houses/townhouses to an average of $2,178.
Two-year rent declines were focused on secondary market rentals, including condos with a 4.7% decrease and an 8.3% decrease in houses/townhouses. Over the past two years, secondary rental markets have experienced rent declines, with condos seeing a 4.7% decrease and houses/townhouses an 8.3% decrease.
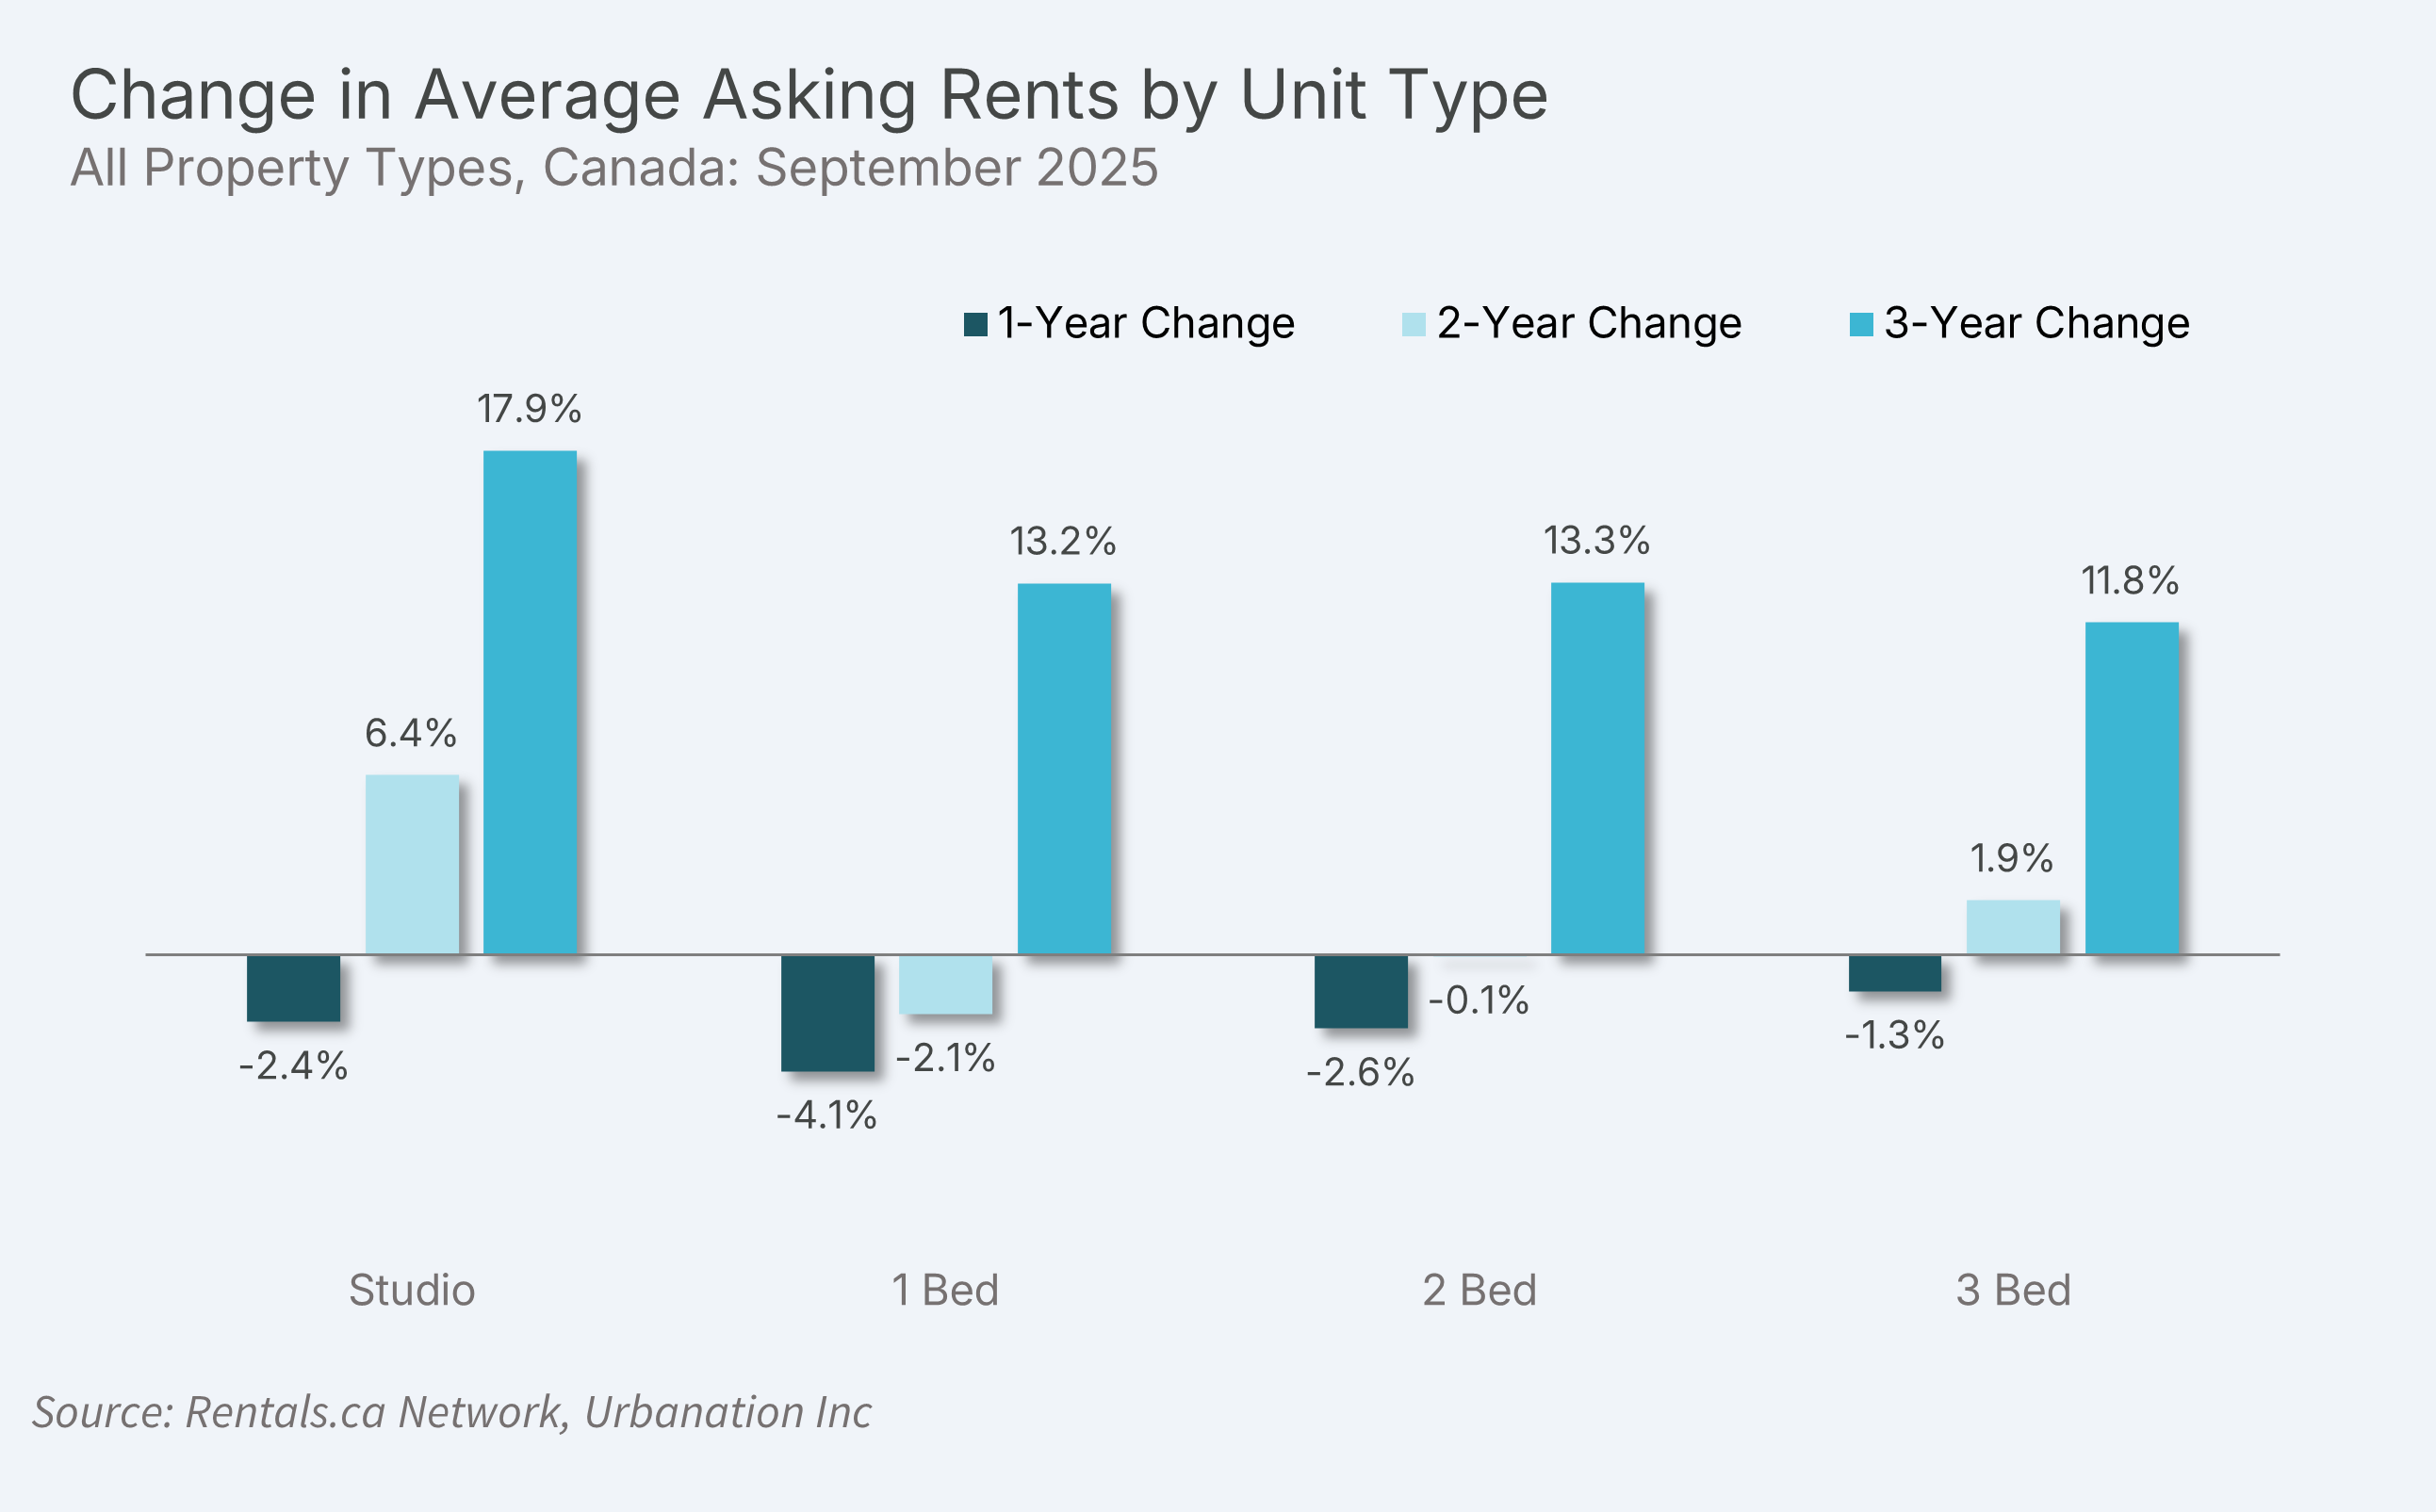
All unit types experienced rent decreases compared to a year ago, led by a 4.1% annual decline in one-bedroom rents to an average of $1,836. Two-bedroom rents decreased 2.6% year-over-year to an average of $2,220, and studio rents declined 2.4% annually to an average of $1,616. Three-bedroom rents recorded the smallest annual decline of 1.3% to an average of $2,561.
Three-Bedroom Apartment Rents Still Rising
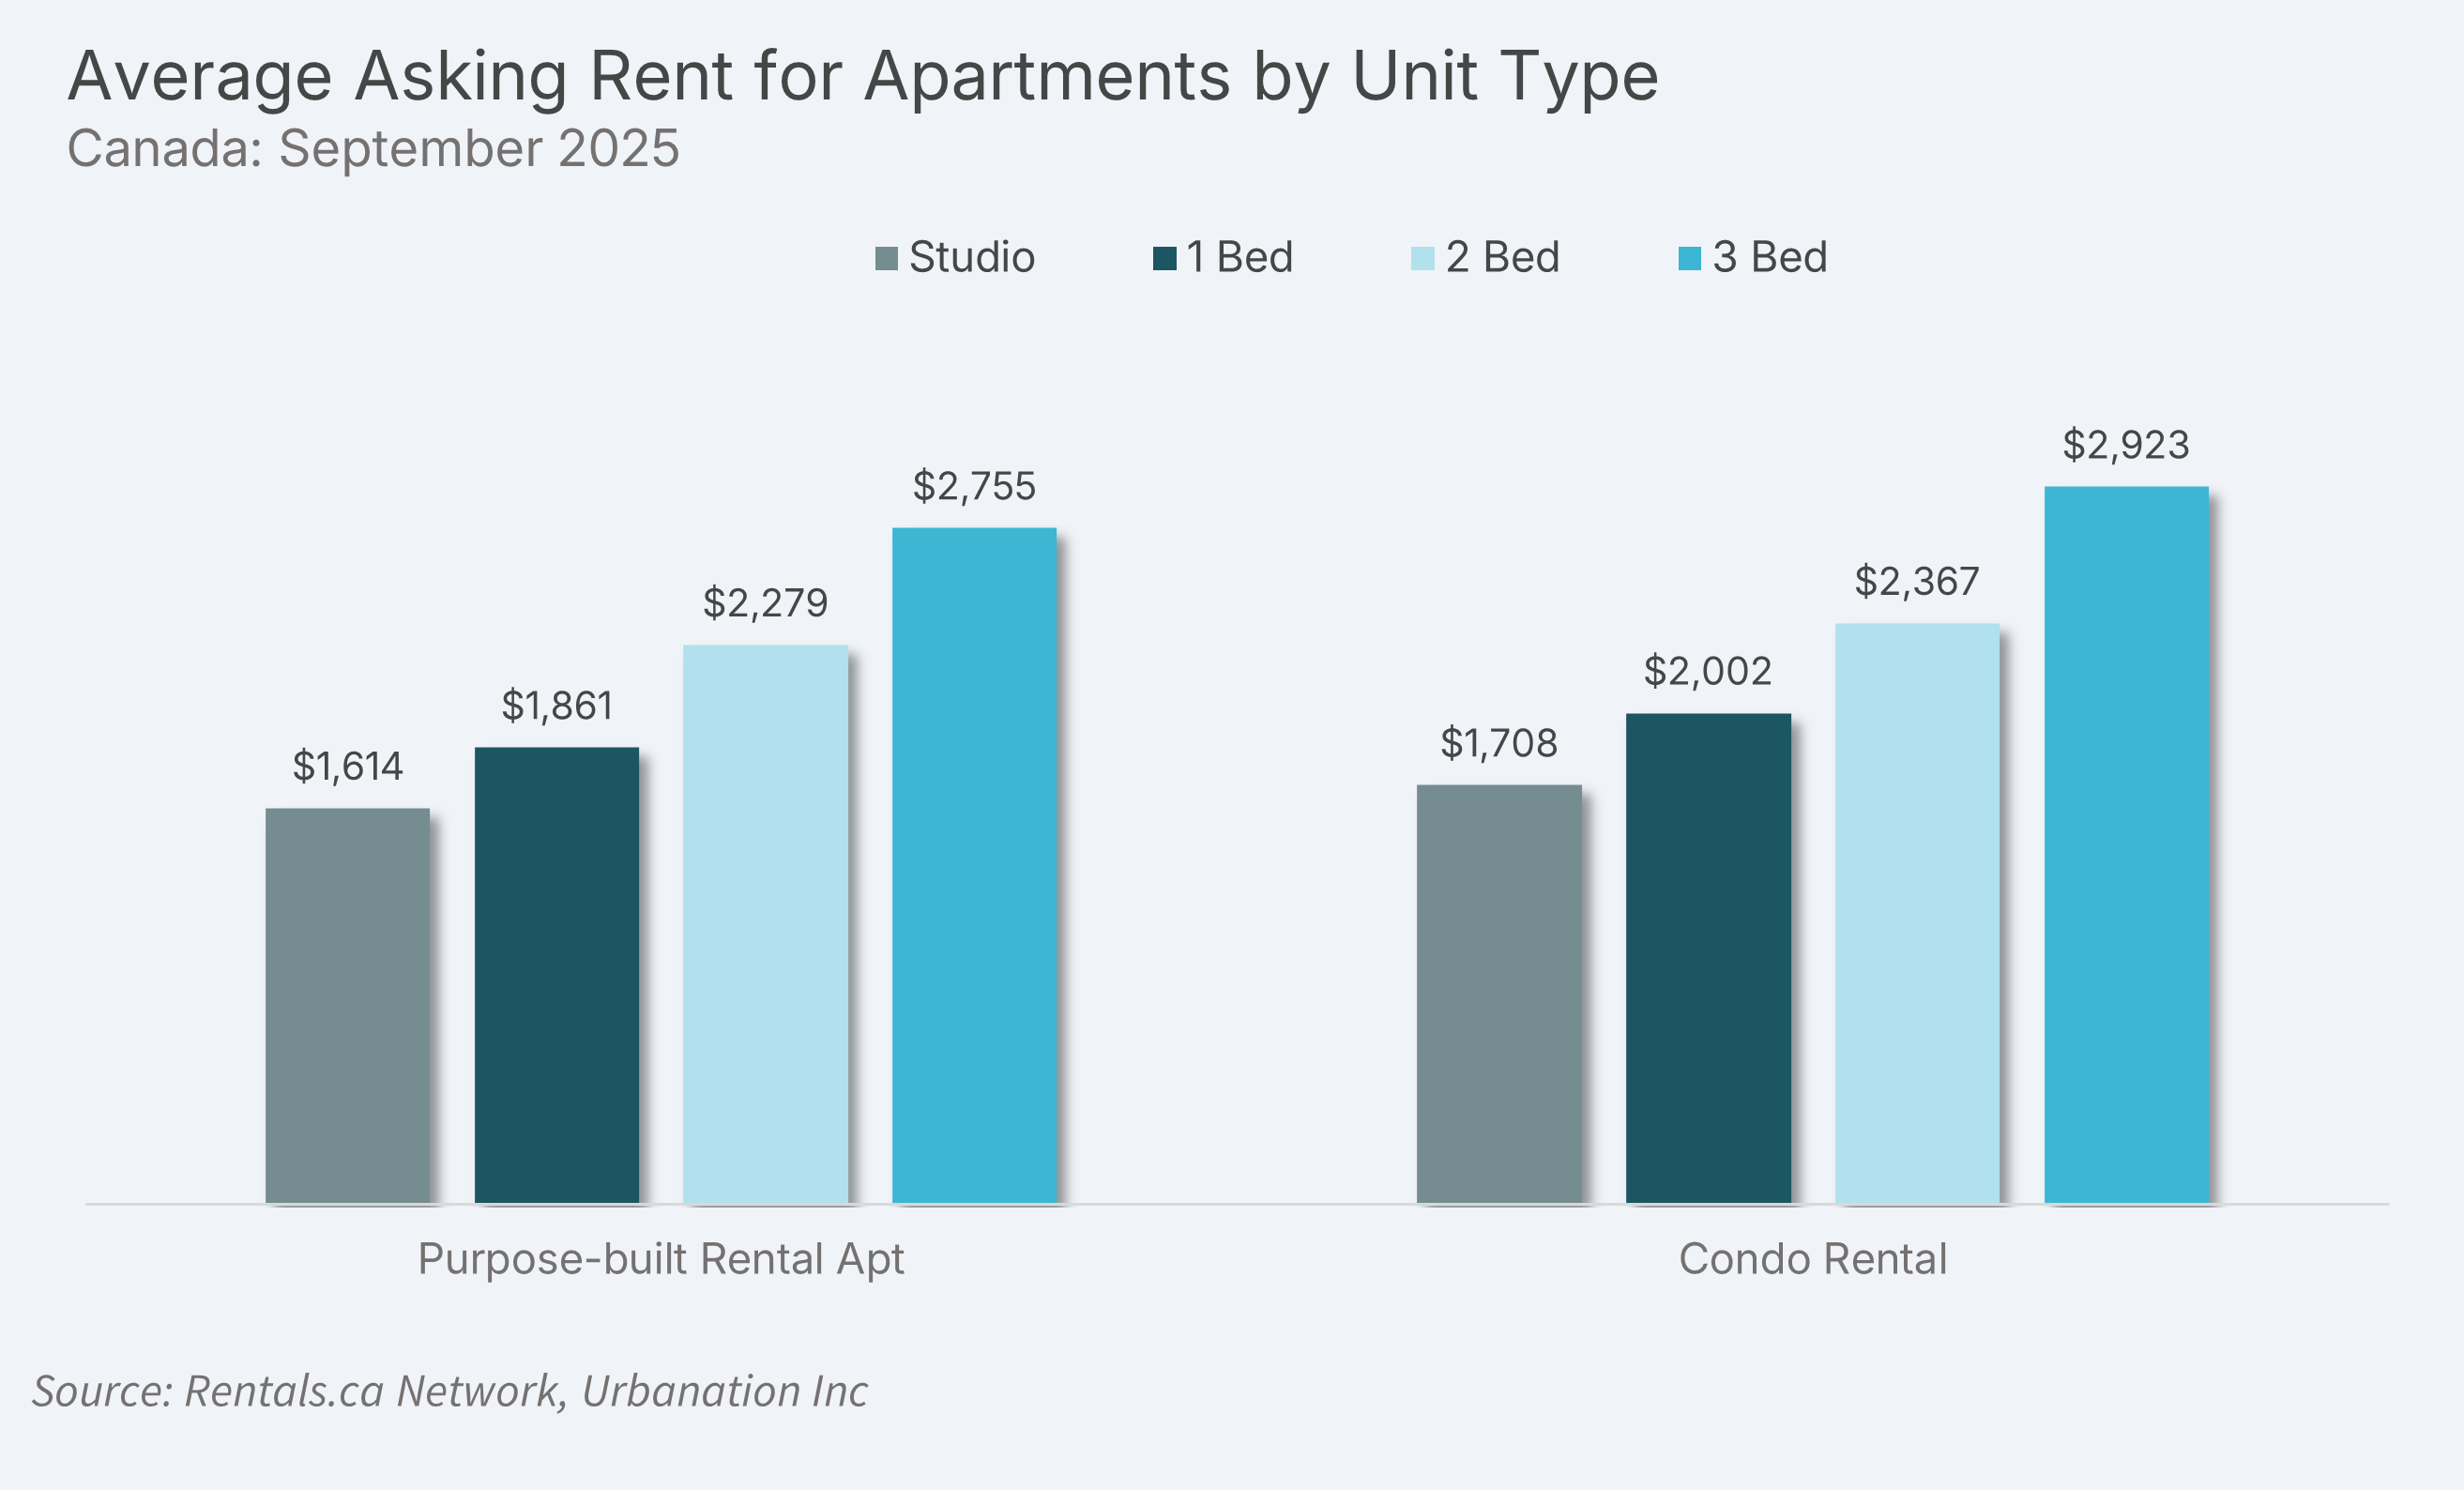
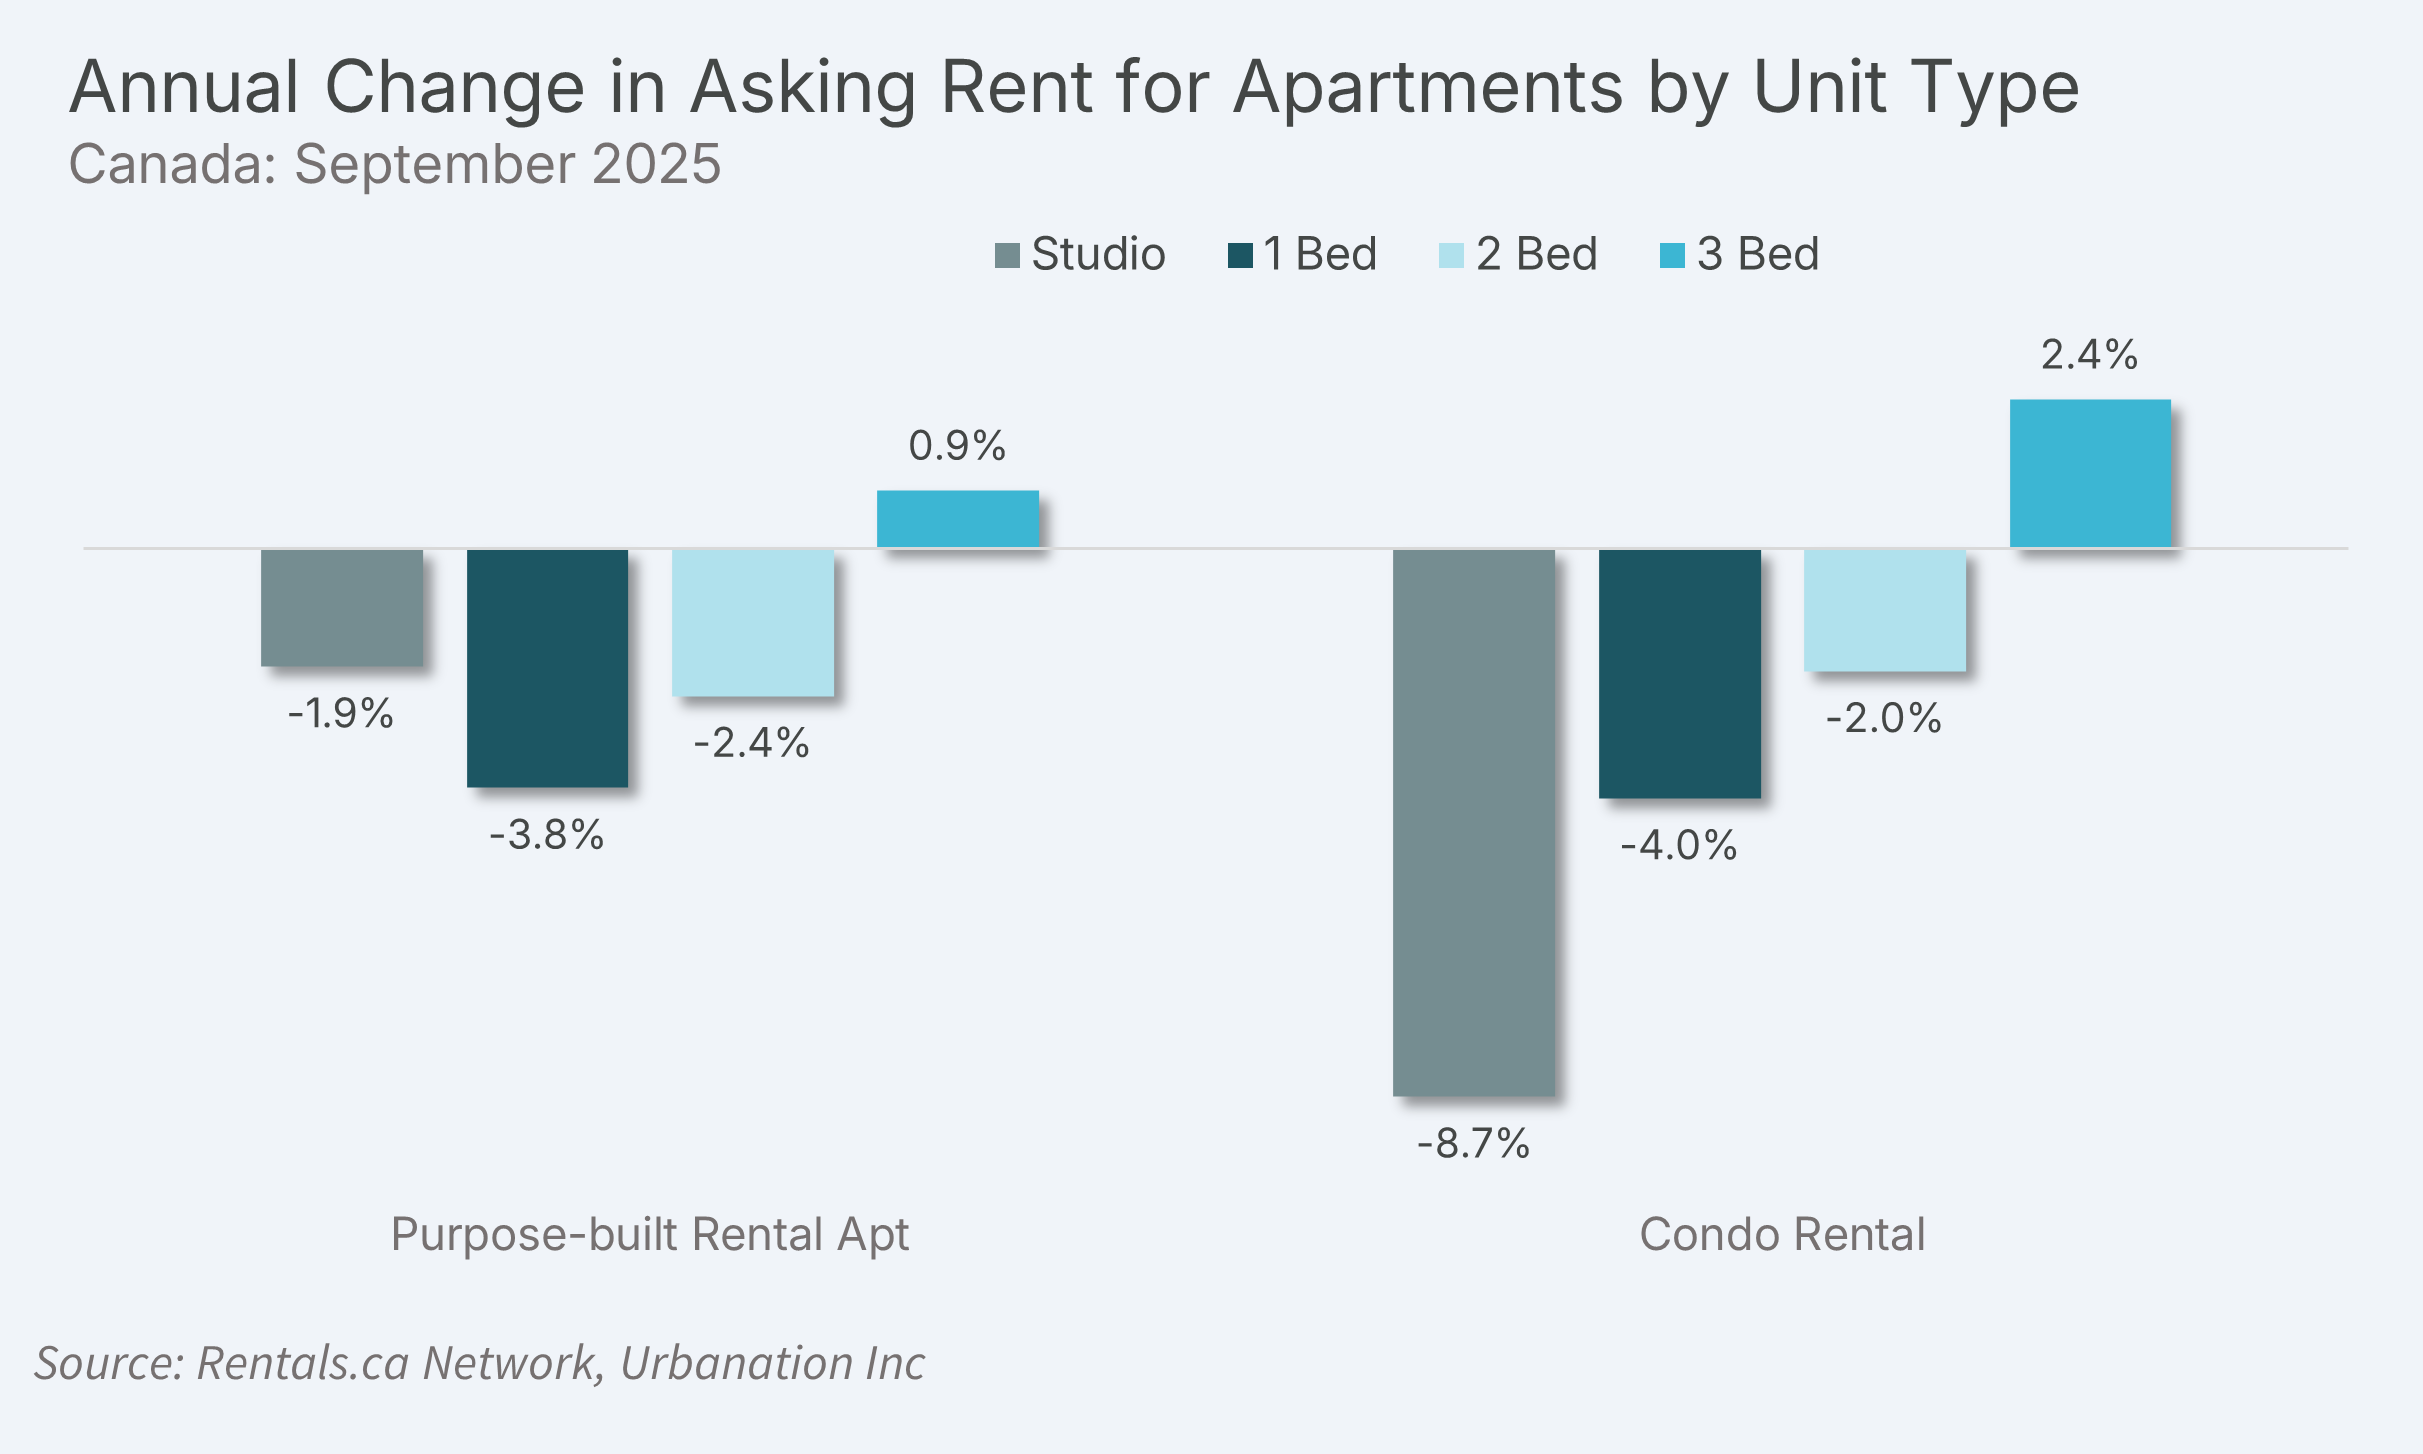
Three-bedroom apartment rents continued to experience annual growth in September, rising 0.9% to an average of $2,755 for purpose-built rentals and increasing 2.4% for condo rentals to an average of $2,923. Apartment rents fell the most over the past year for studio condos, which dropped 8.7% to an average of $1,708.
Provincial Overview
BC and Alberta Lead Provincial Rent Declines
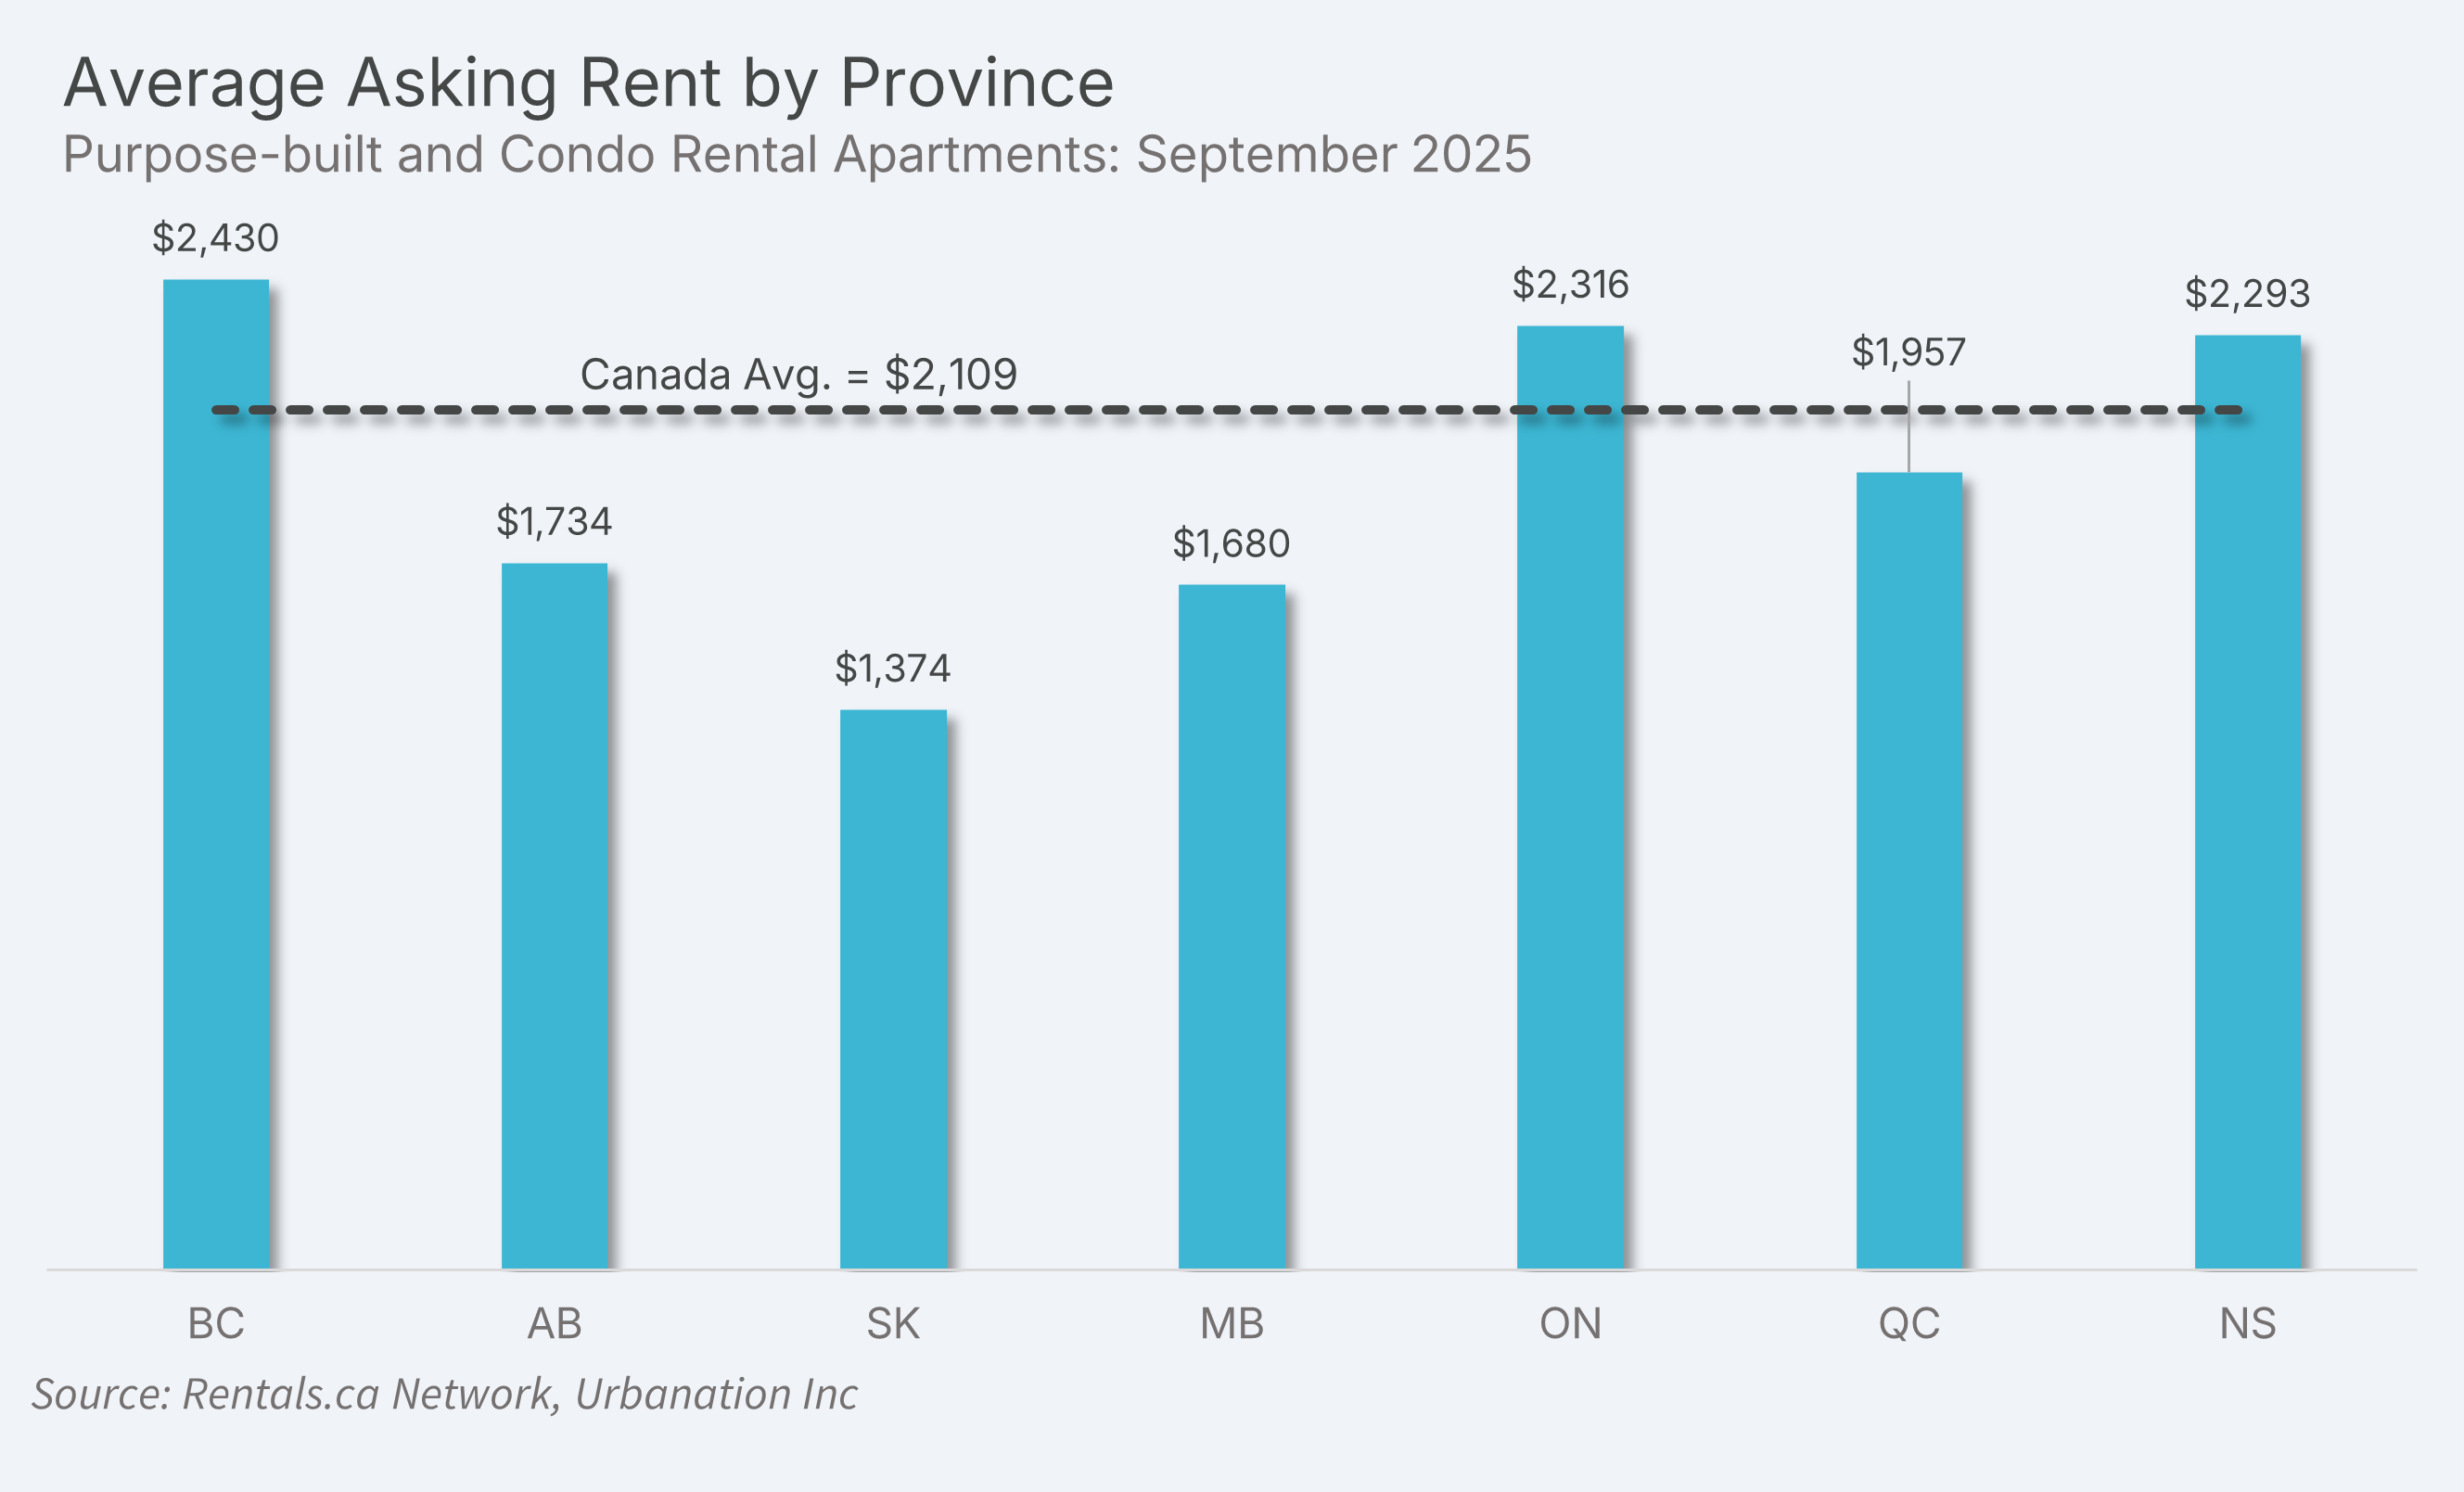
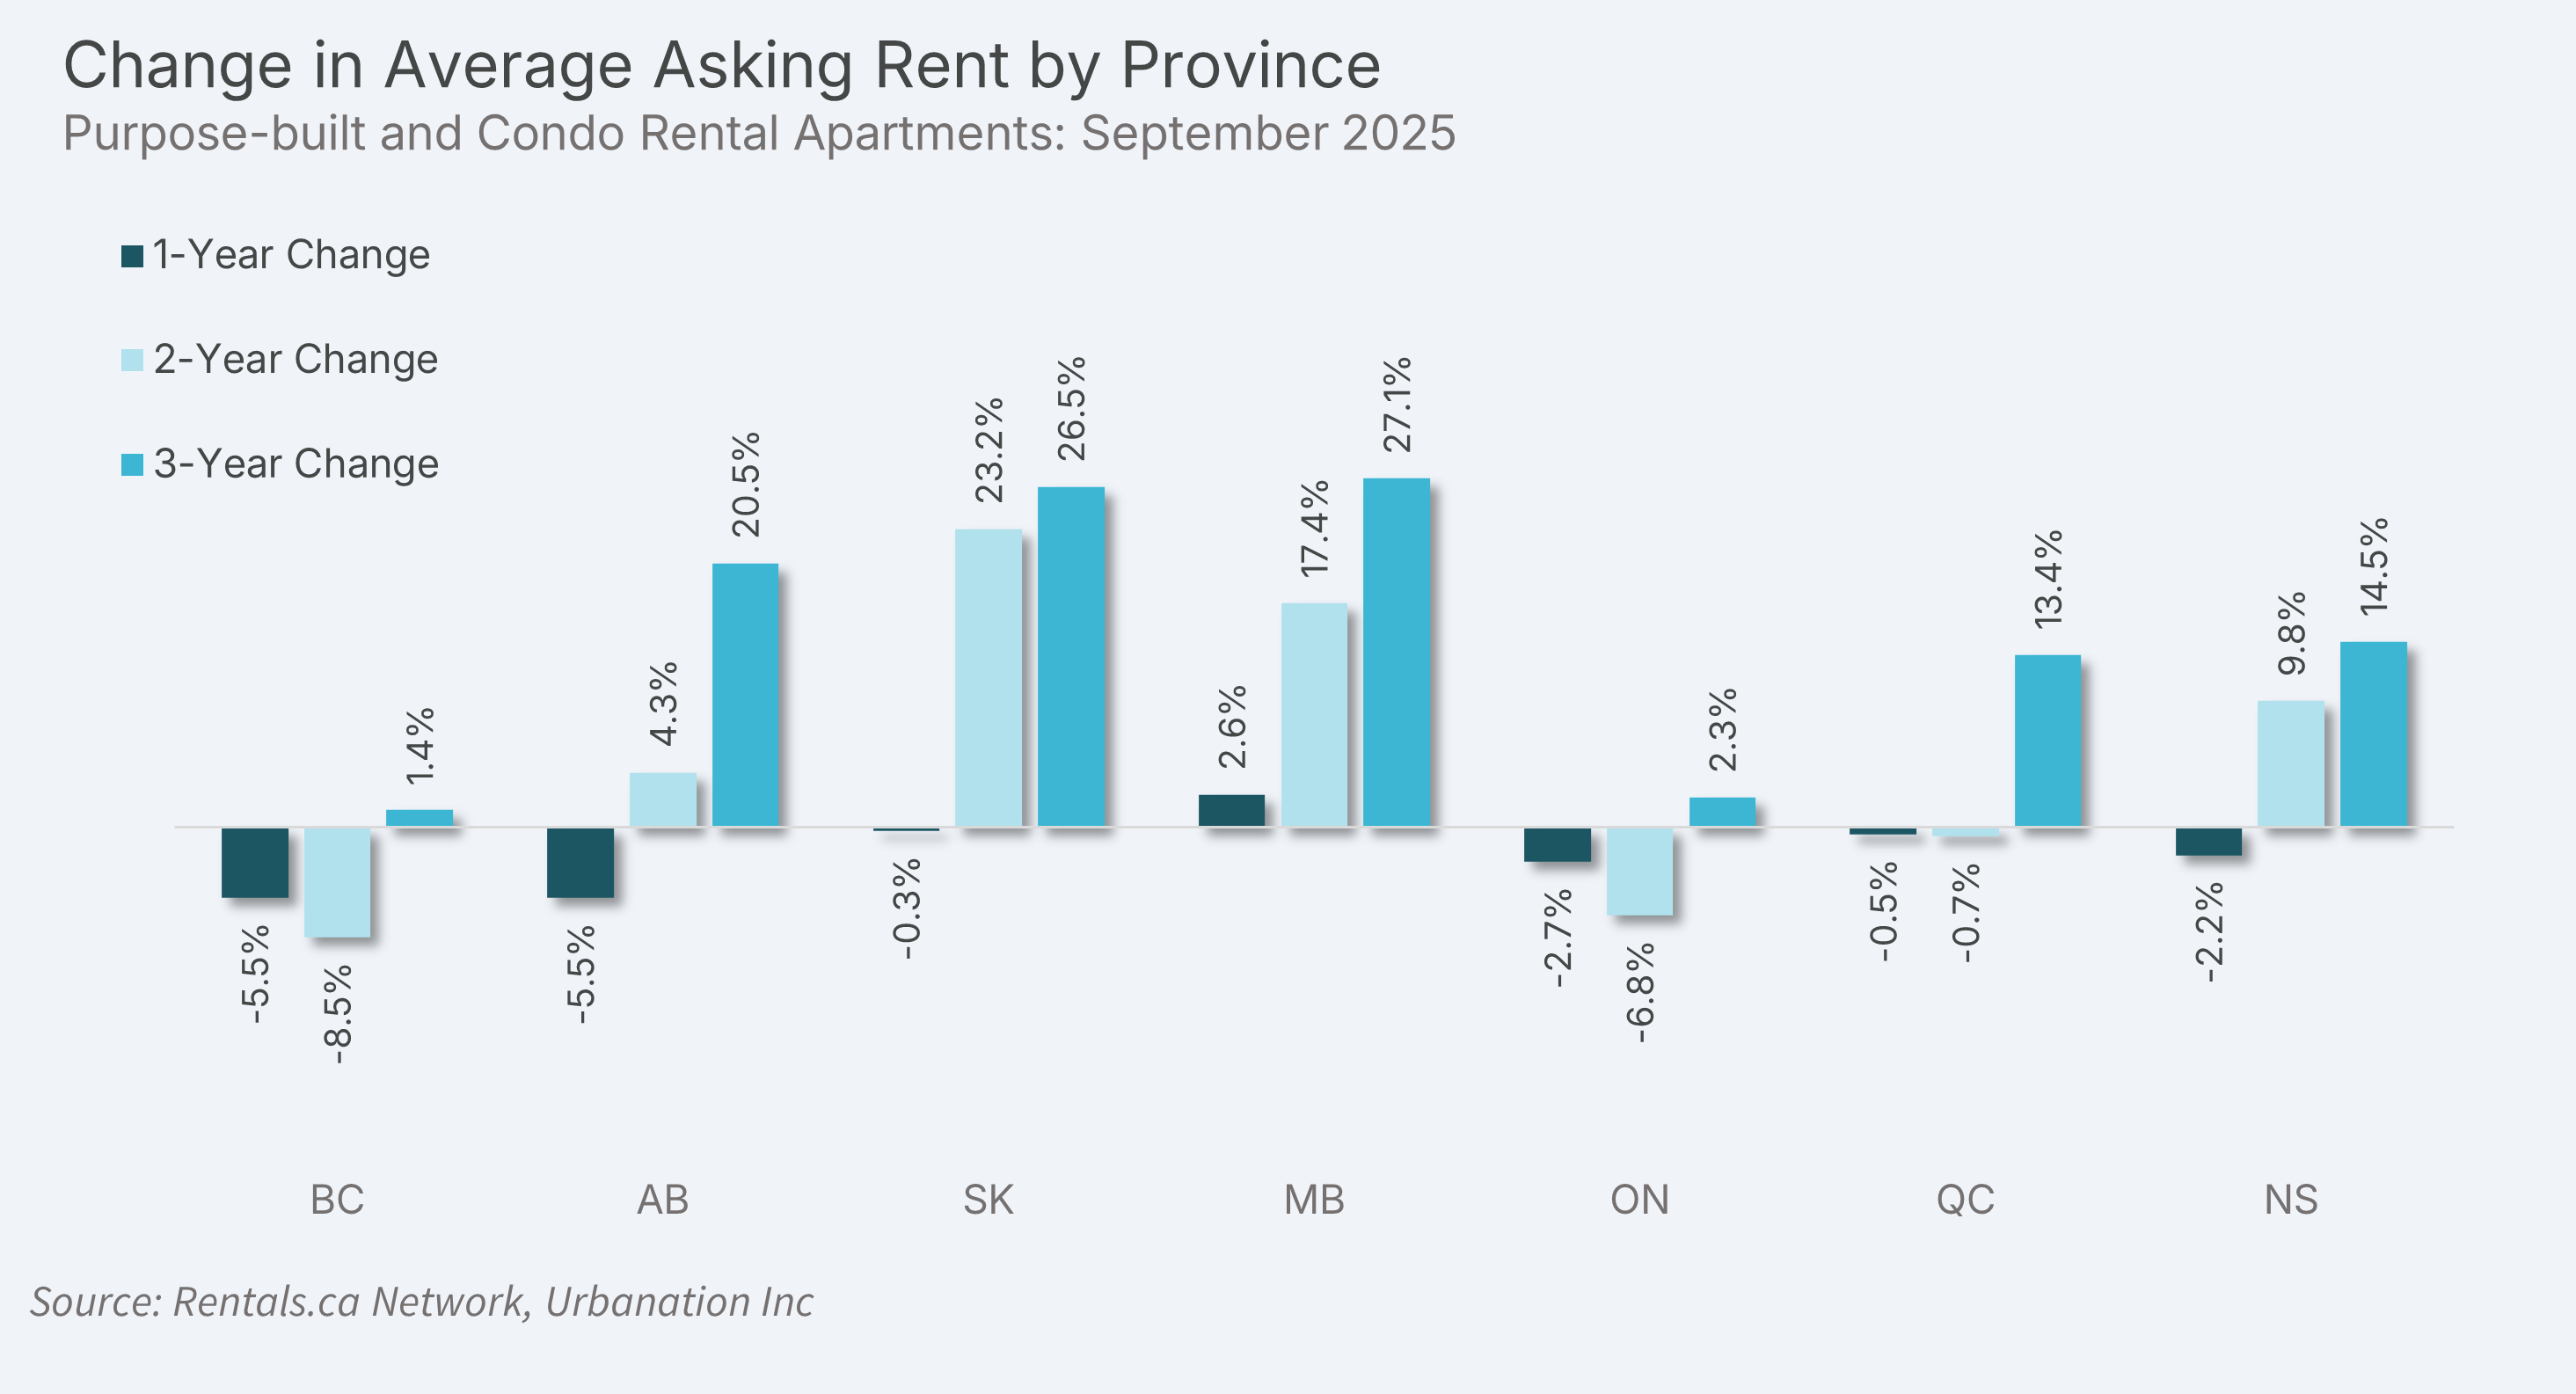
Overall, rents for purpose-built and condo apartments in Canada decreased 2.3% annually in September to an average of $2,109. Regionally, apartment rents fell the most during the past year in B.C. (-5.5% to $2,430) and Alberta (-5.5% to $1,734). Apartment rents also declined in Ontario (-2.7% to $2,316) and Nova Scotia (-2.2% to $2,293), with smaller annual decreases in Quebec (-0.5% to $1,957) and Saskatchewan (-0.3% to $1,374). Meanwhile, apartment rents continued to report annual growth in Manitoba (+2.6% to $1,680).
Two-year declines for apartment rents were isolated to B.C. (-8.5%), Ontario (-6.8%) and, to a lesser extent, Quebec (-0.7%). Compared to three years ago, apartment rents recorded small gains in B.C. (+1.4%) and Ontario (+2.3%), with the fastest three-year growth found in the Prairie provinces of Manitoba (+27.1%), Saskatchewan (+26.5%), and Alberta (+20.5%).
Municipal Overview
Rents Down Across Six Largest Markets
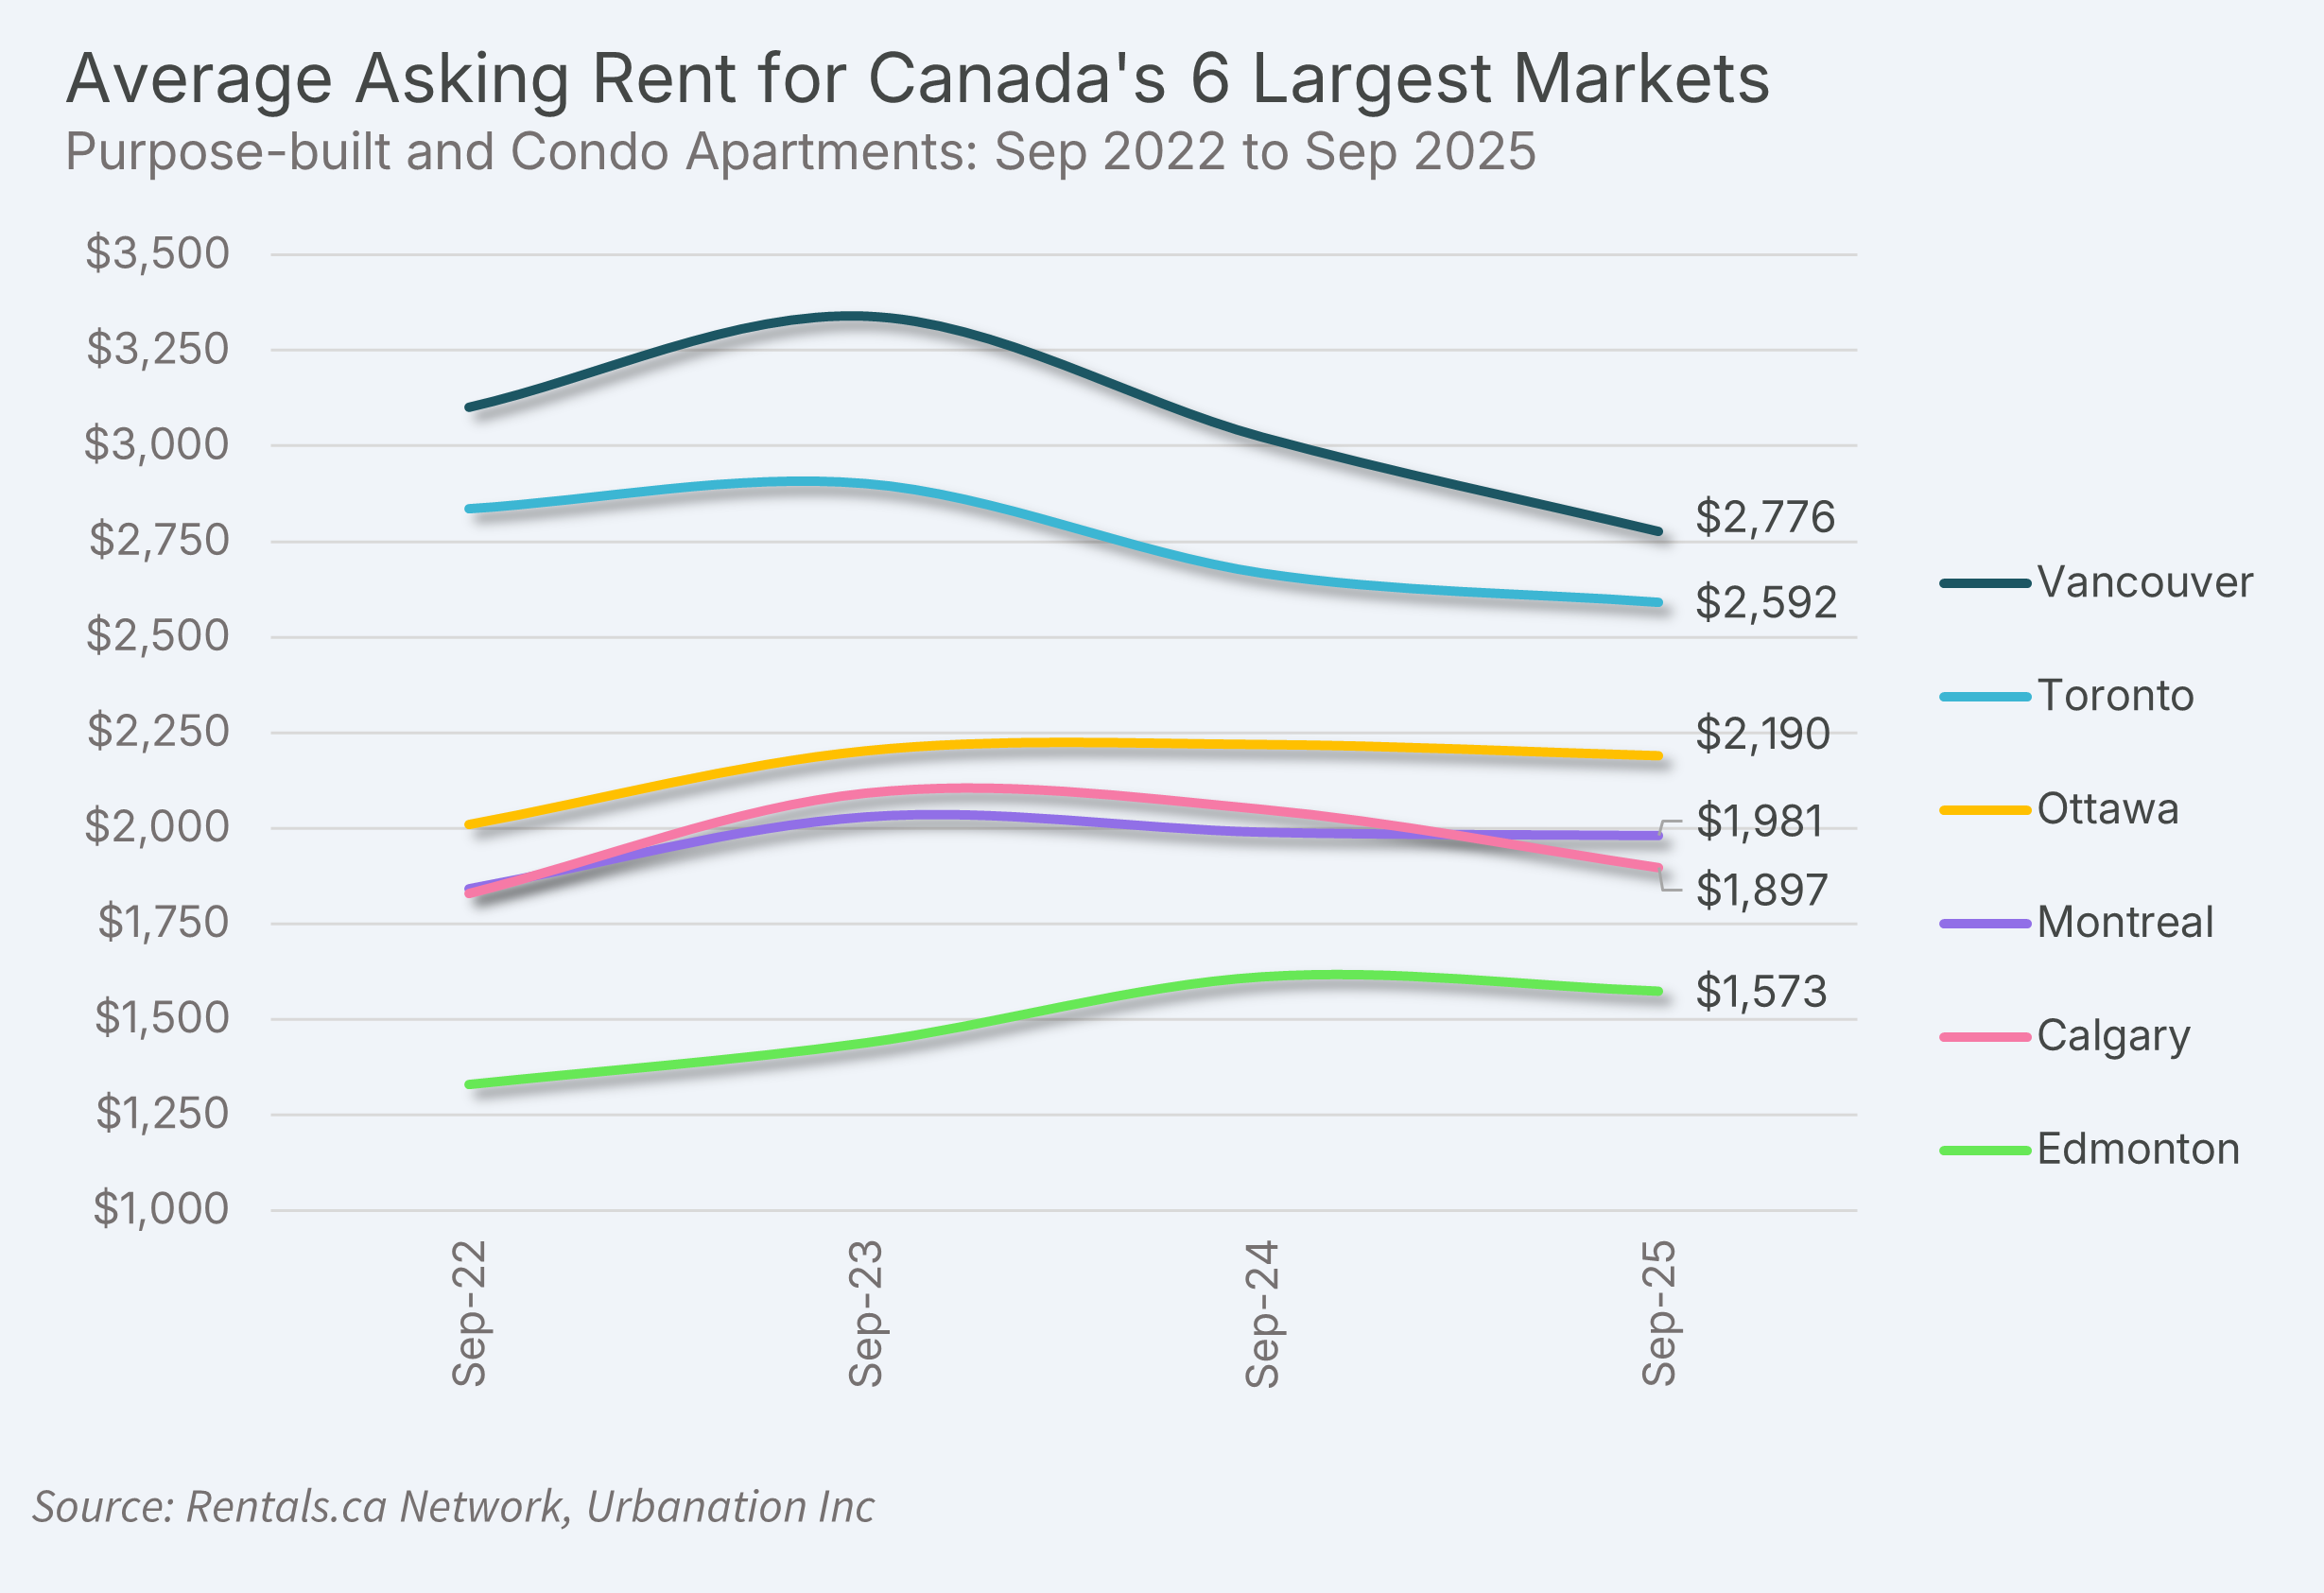
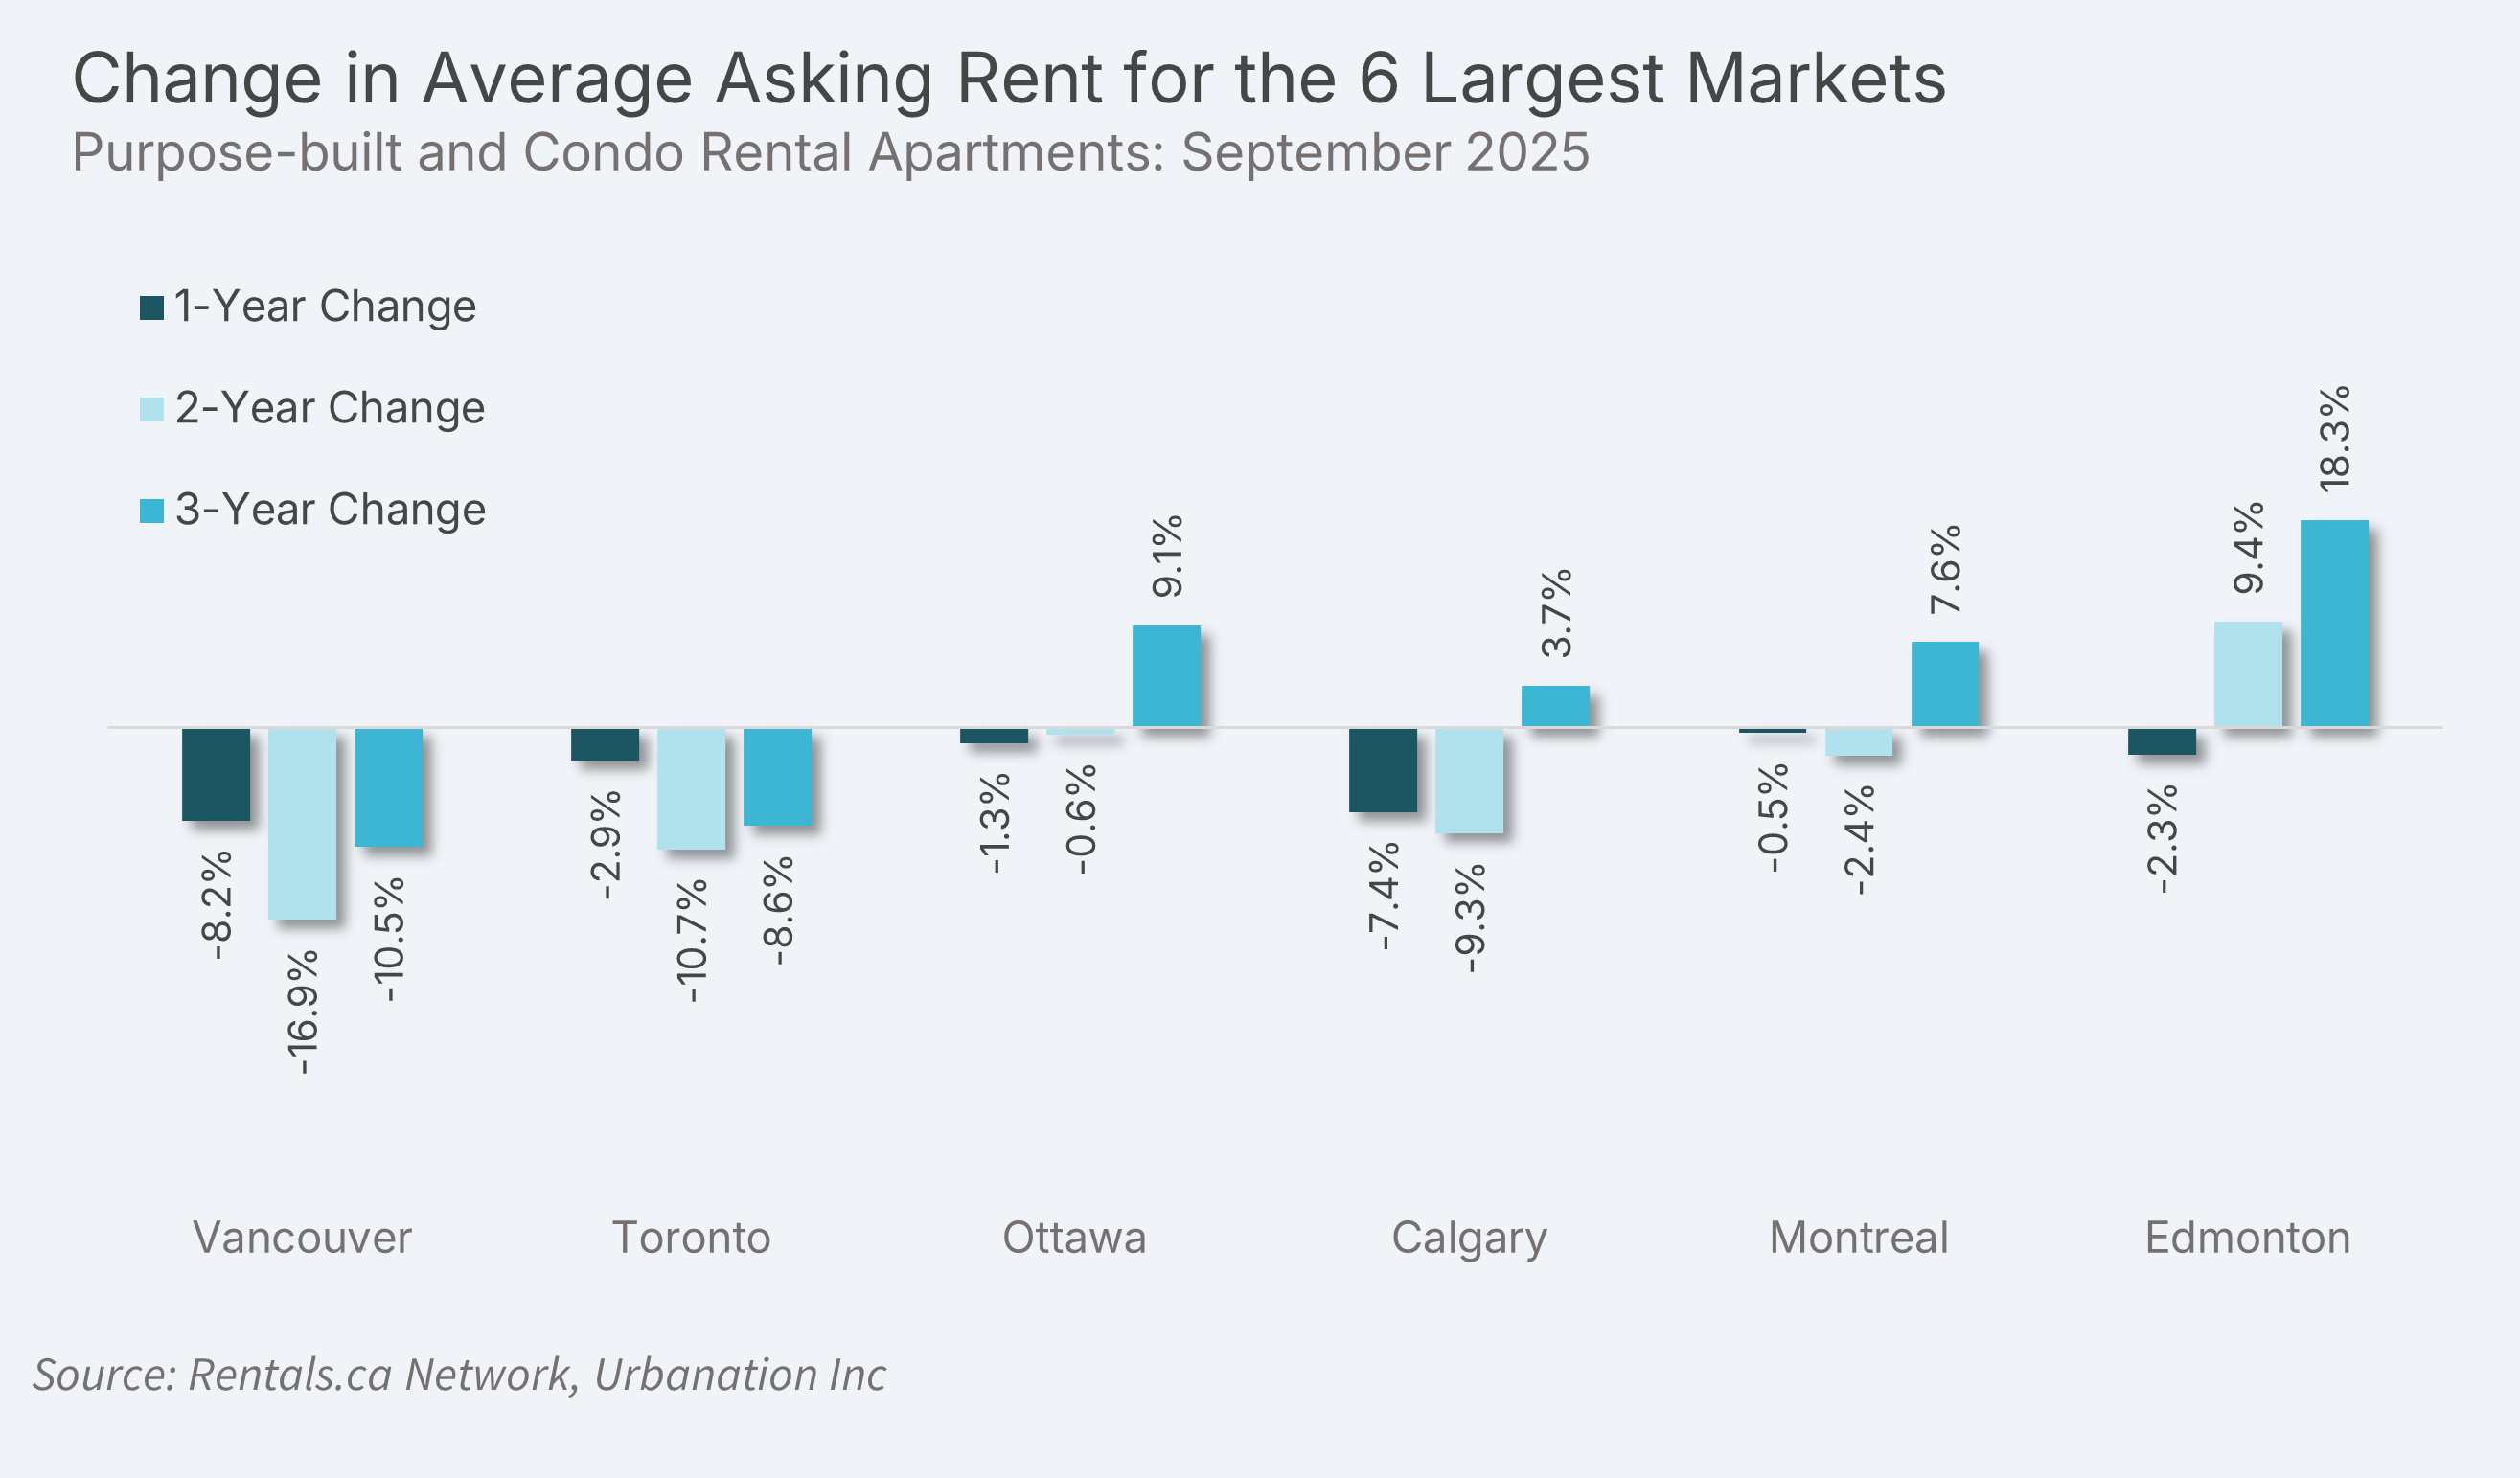
Each of Canada’s six largest cities posted annual rent declines for apartments in September, with the largest drops found in Vancouver (-8.2% to $2,776) and Calgary (-7.4% to $1,897).
In Toronto, the 2.9% annual decrease in apartment rents to an average of $2,592 was the smallest decline of the past 16 months. Apartment rents in Edmonton fell the most since COVID-19 (-2.3% to $1,573), while smaller annual decreases were found in Ottawa (-1.3% to $2,190) and Montreal (-0.5% to $1,981).
In the past two years, average apartment rents fell 16.9% in Vancouver, 10.7% in Toronto, and 9.3% in Calgary. Vancouver and Toronto rents were also down compared to three years ago, with declines of 10.5% and 8.6%, respectively. In Vancouver, rents in September were at a 41-month low.
The top three cities (among the six largest) for apartment rent growth over the past three years were Edmonton (+18.3%), Ottawa (+9.1%), and Montreal (+7.6%).
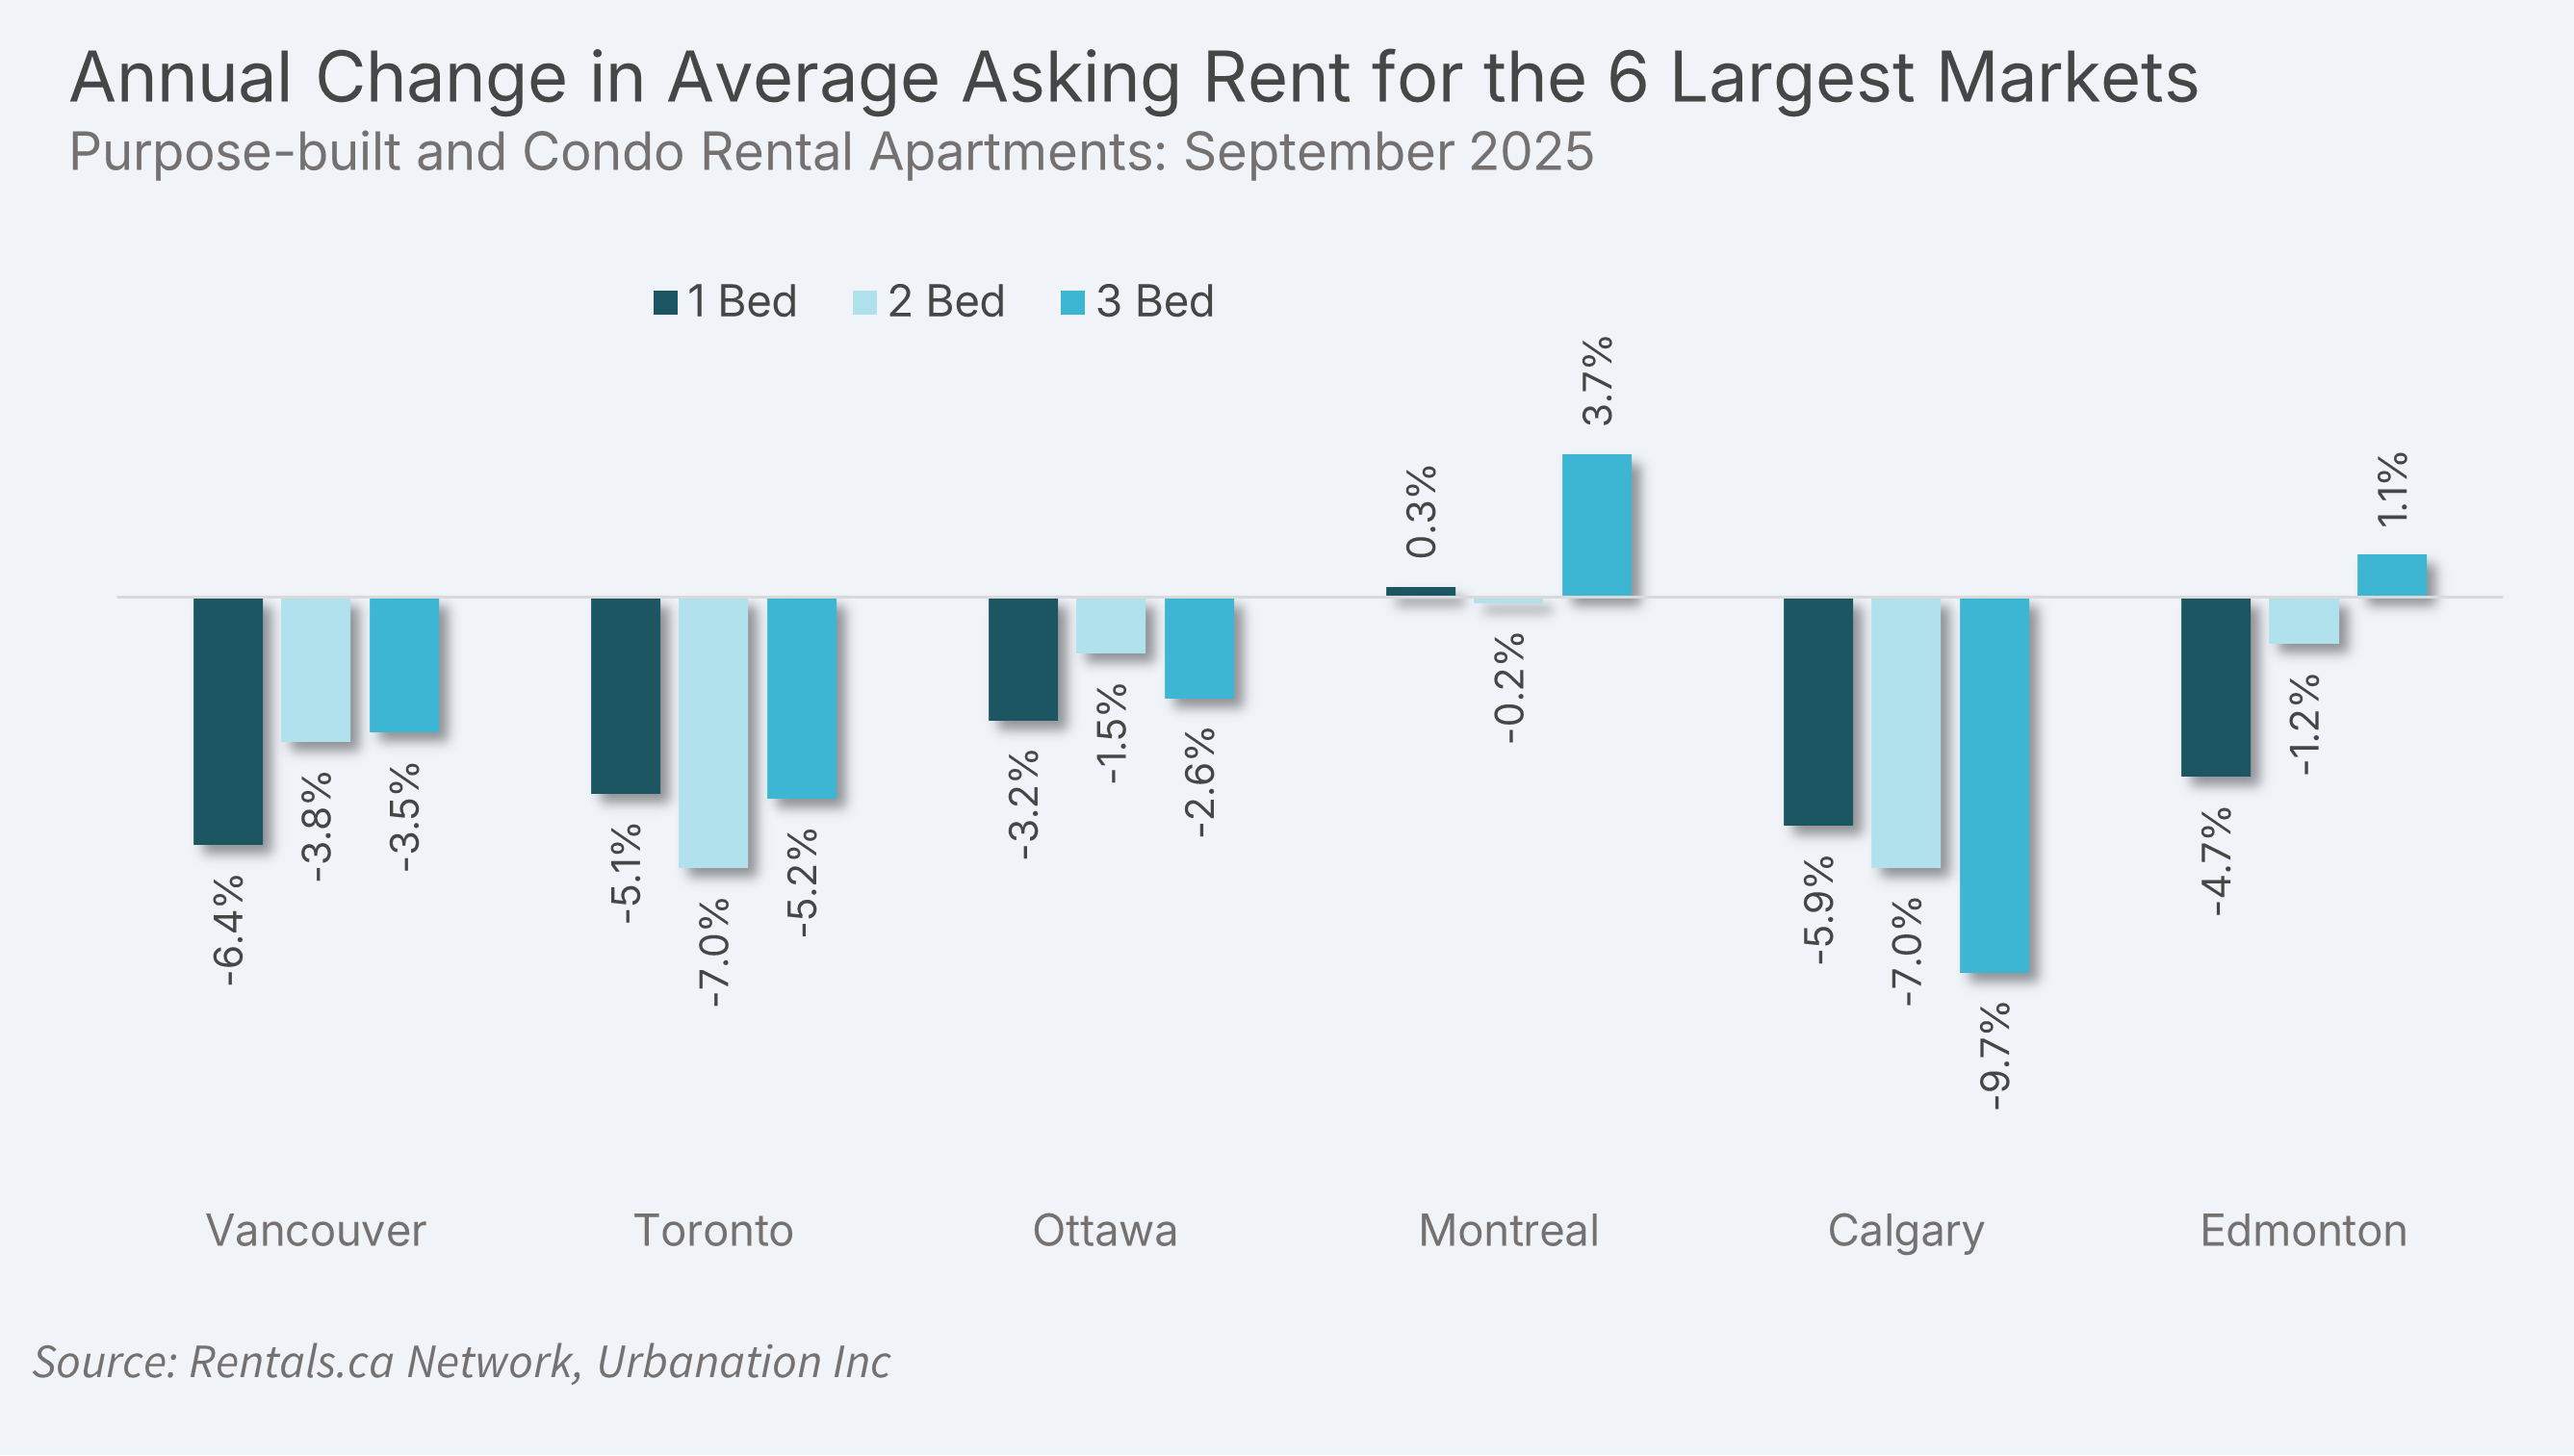
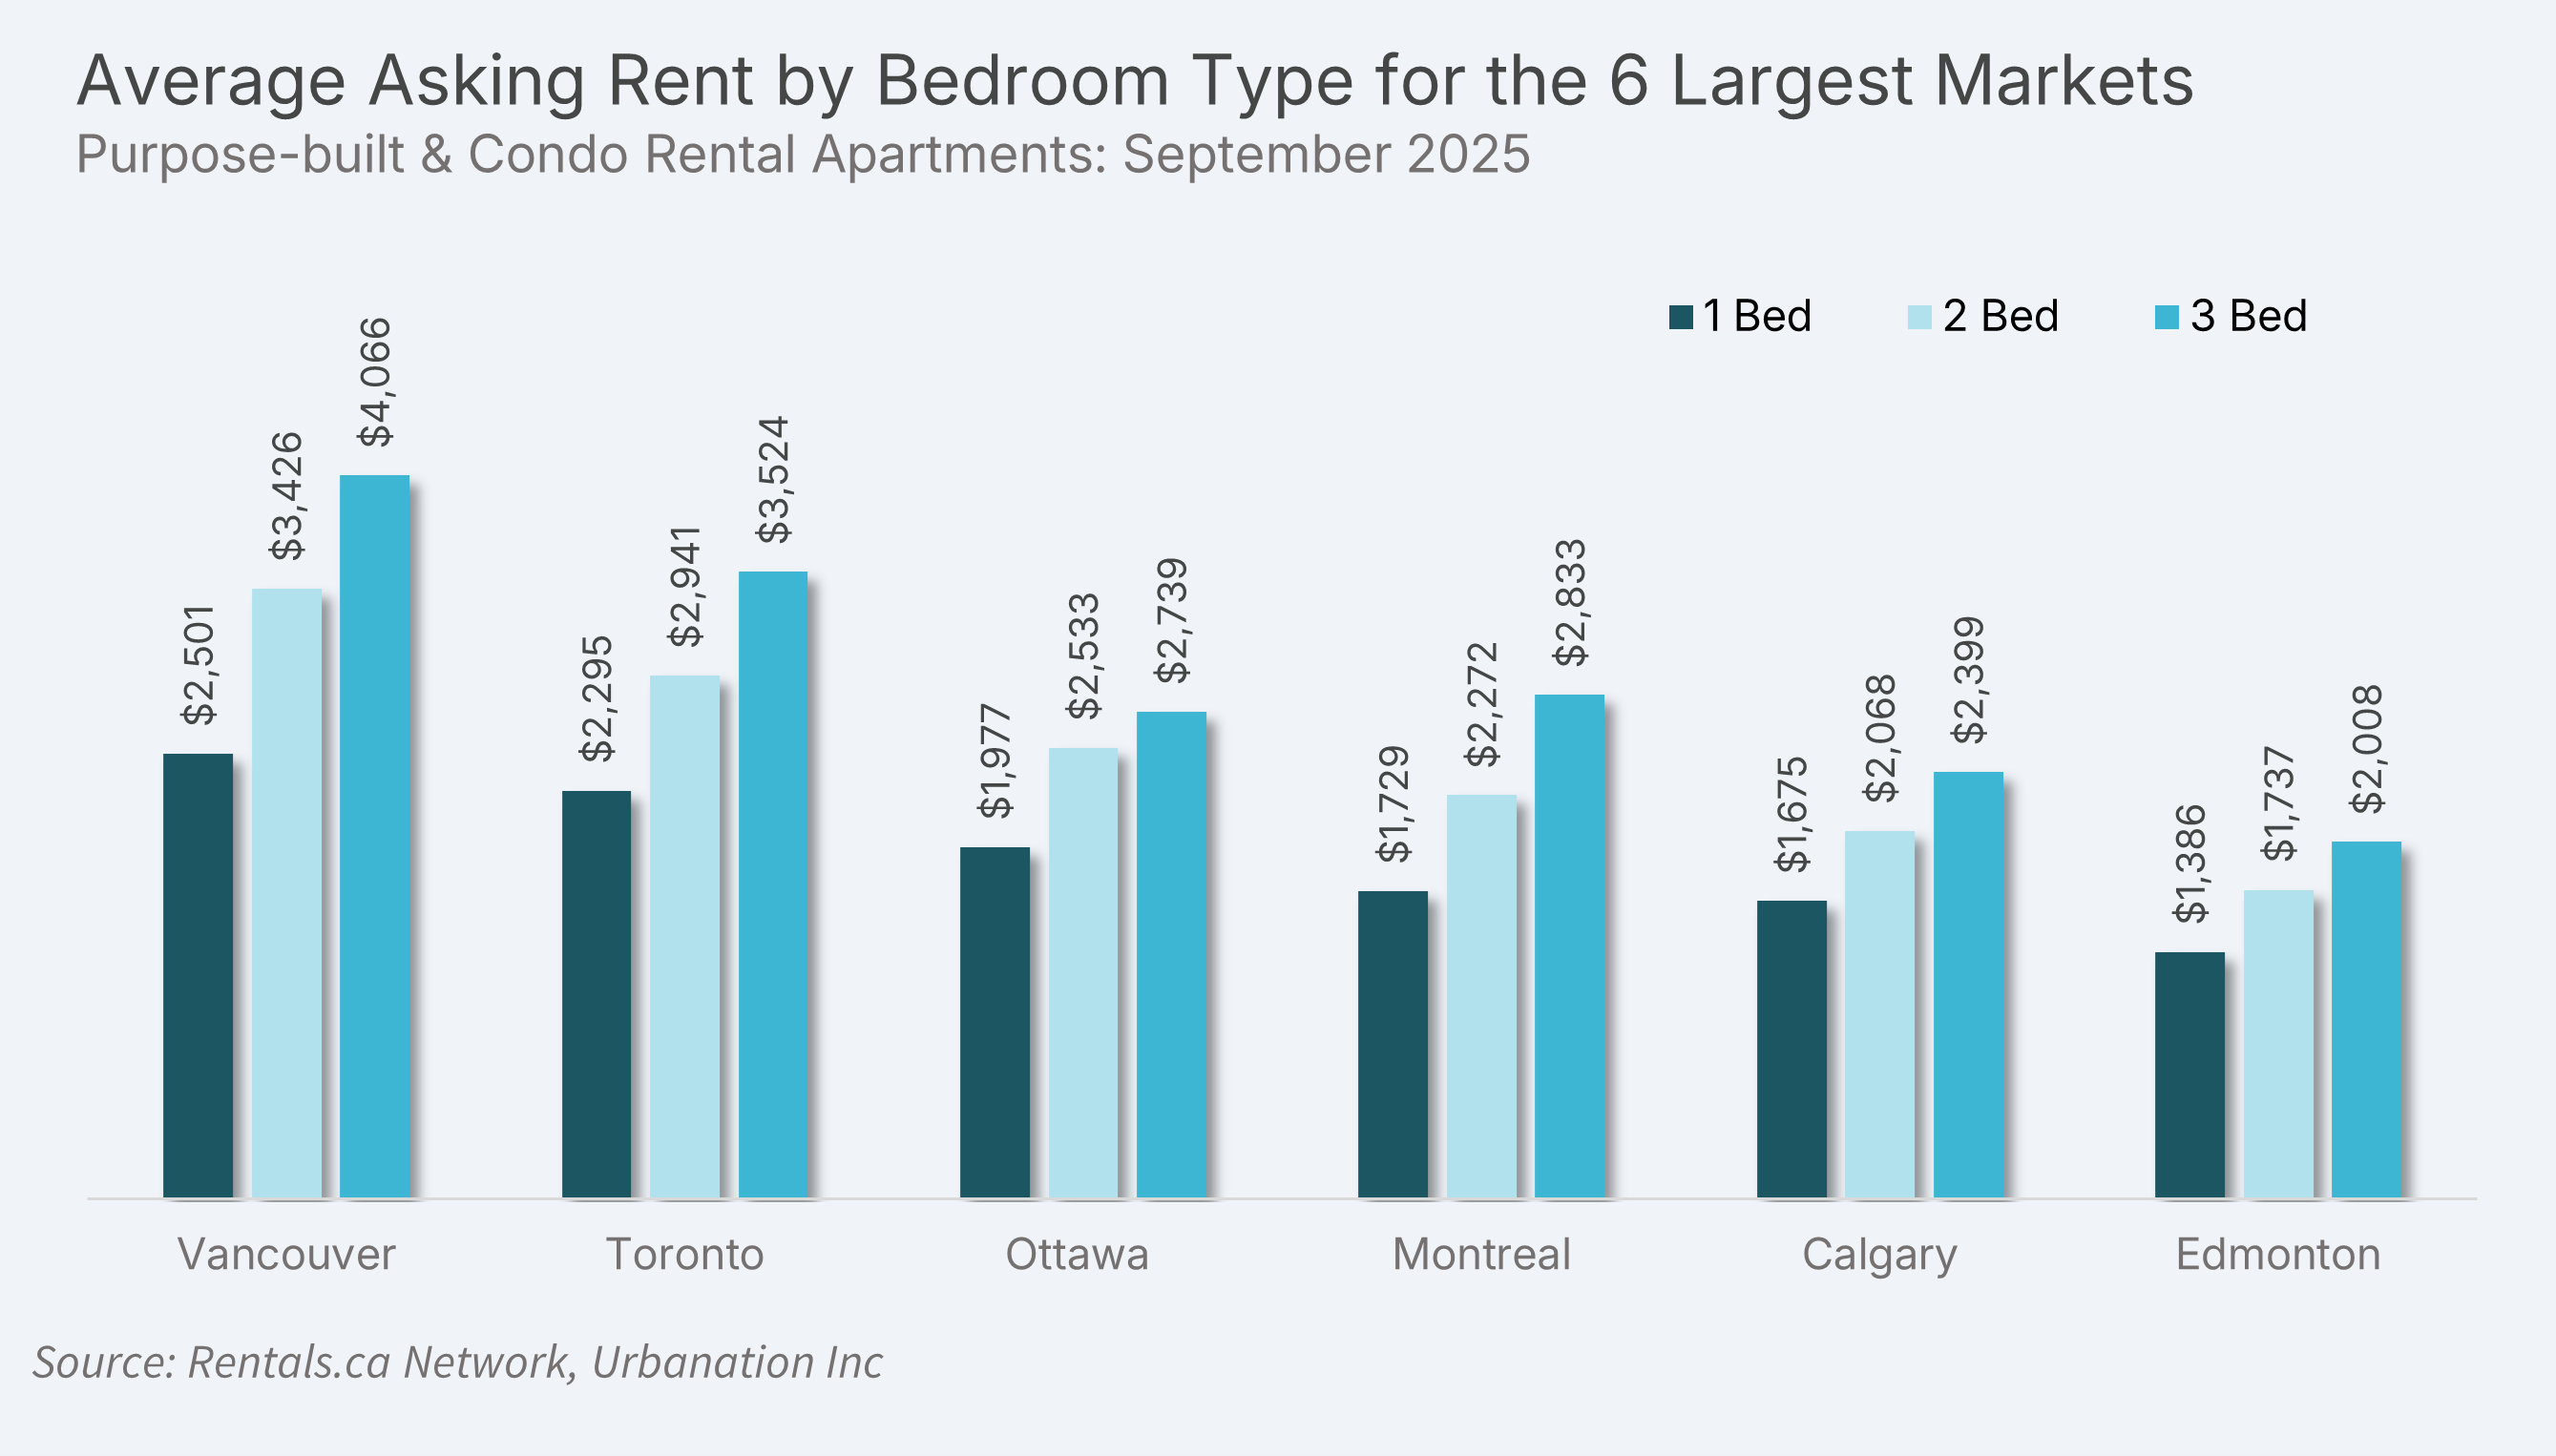
Three-Bedroom Rents Rise in Montreal and Edmonton
Three-bedroom apartment rents experienced year-over-year growth of 3.2% in Montreal (to $2,810) and 4.9% in Edmonton (to $2,035). In Calgary, three-bedroom apartments saw the steepest annual decline of 10.5% (to $2,406). Vancouver posted the largest year-over-year rent decrease for one-bedroom apartments (-8.1% to $2,515), while Toronto recorded the biggest annual decline for two-bedroom apartment rents (-7.4% to $2,946).
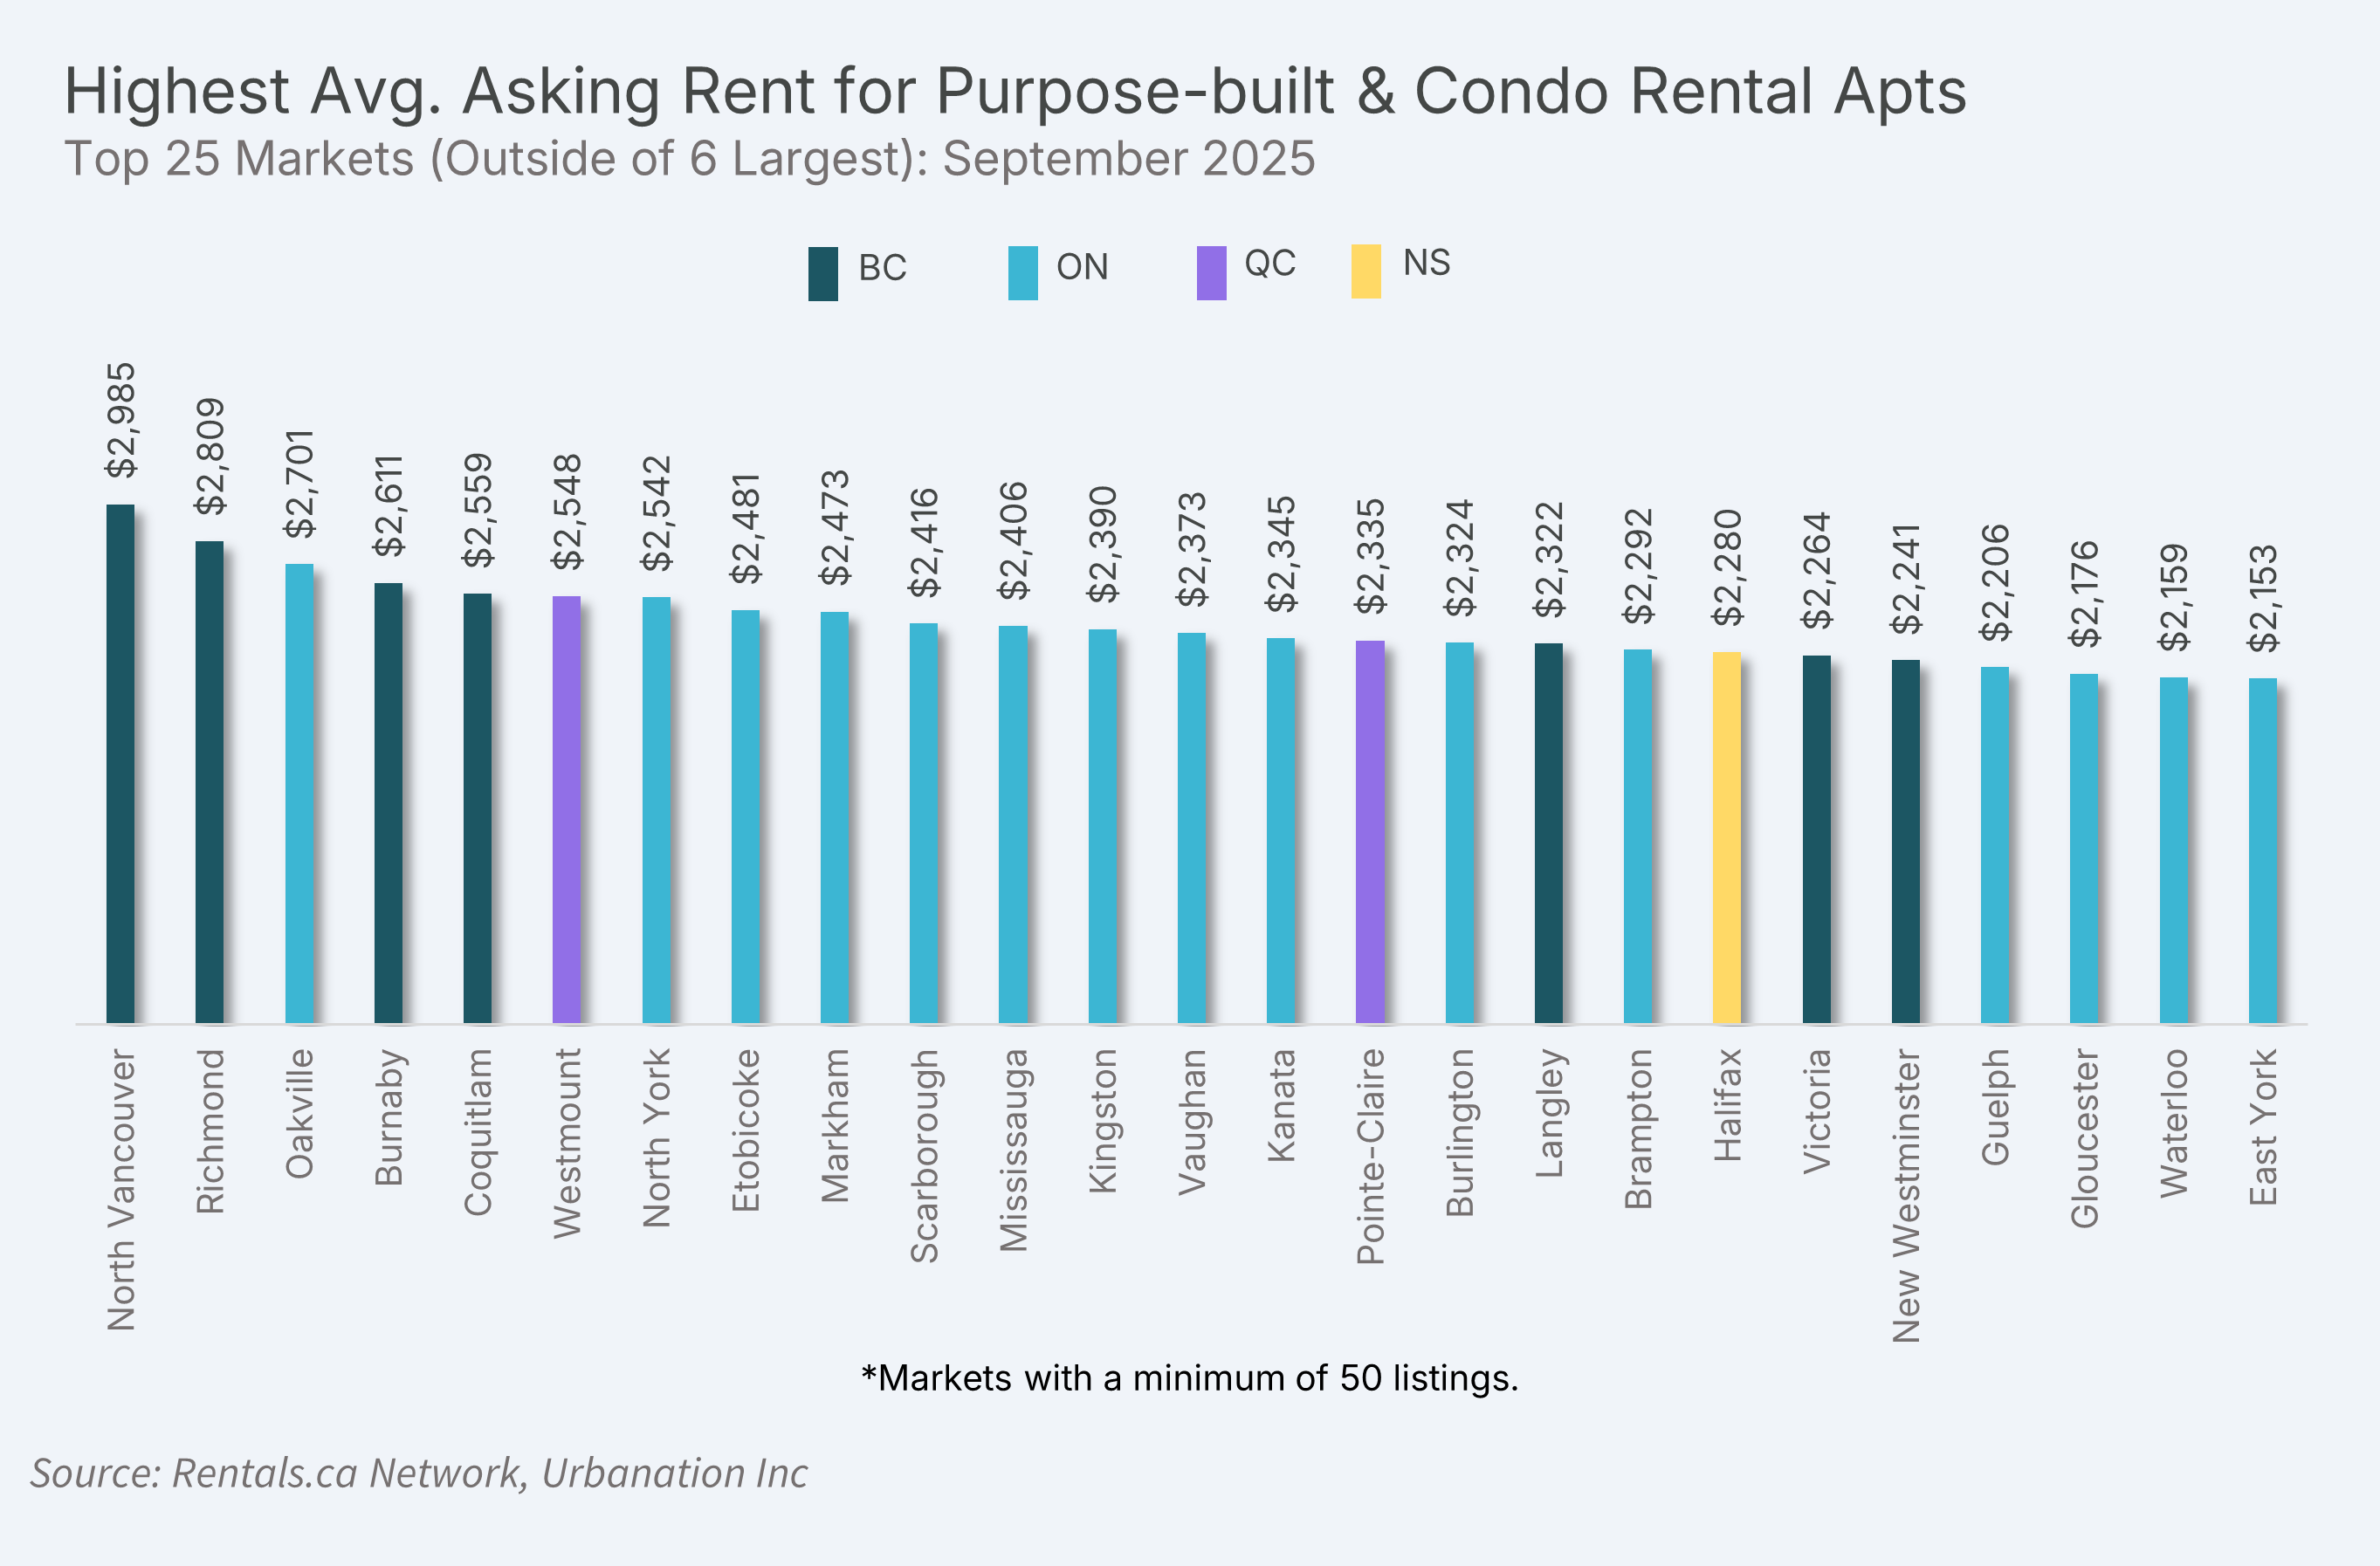
Metro Vancouver Still Most Expensive
Four of the five most expensive cities (outside of the six largest) for apartment rents were located in Metro Vancouver and included North Vancouver ($2,985), Richmond ($2,809), Burnaby ($2,611) and Coquitlam ($2,559). Outside of B.C., Oakville (ON) ranked third ($2,701) and Westmount (QC) ranked sixth ($2,548). Overall, 14 of the 25 most expensive cities were in Ontario, including nine in the Greater Toronto Area.
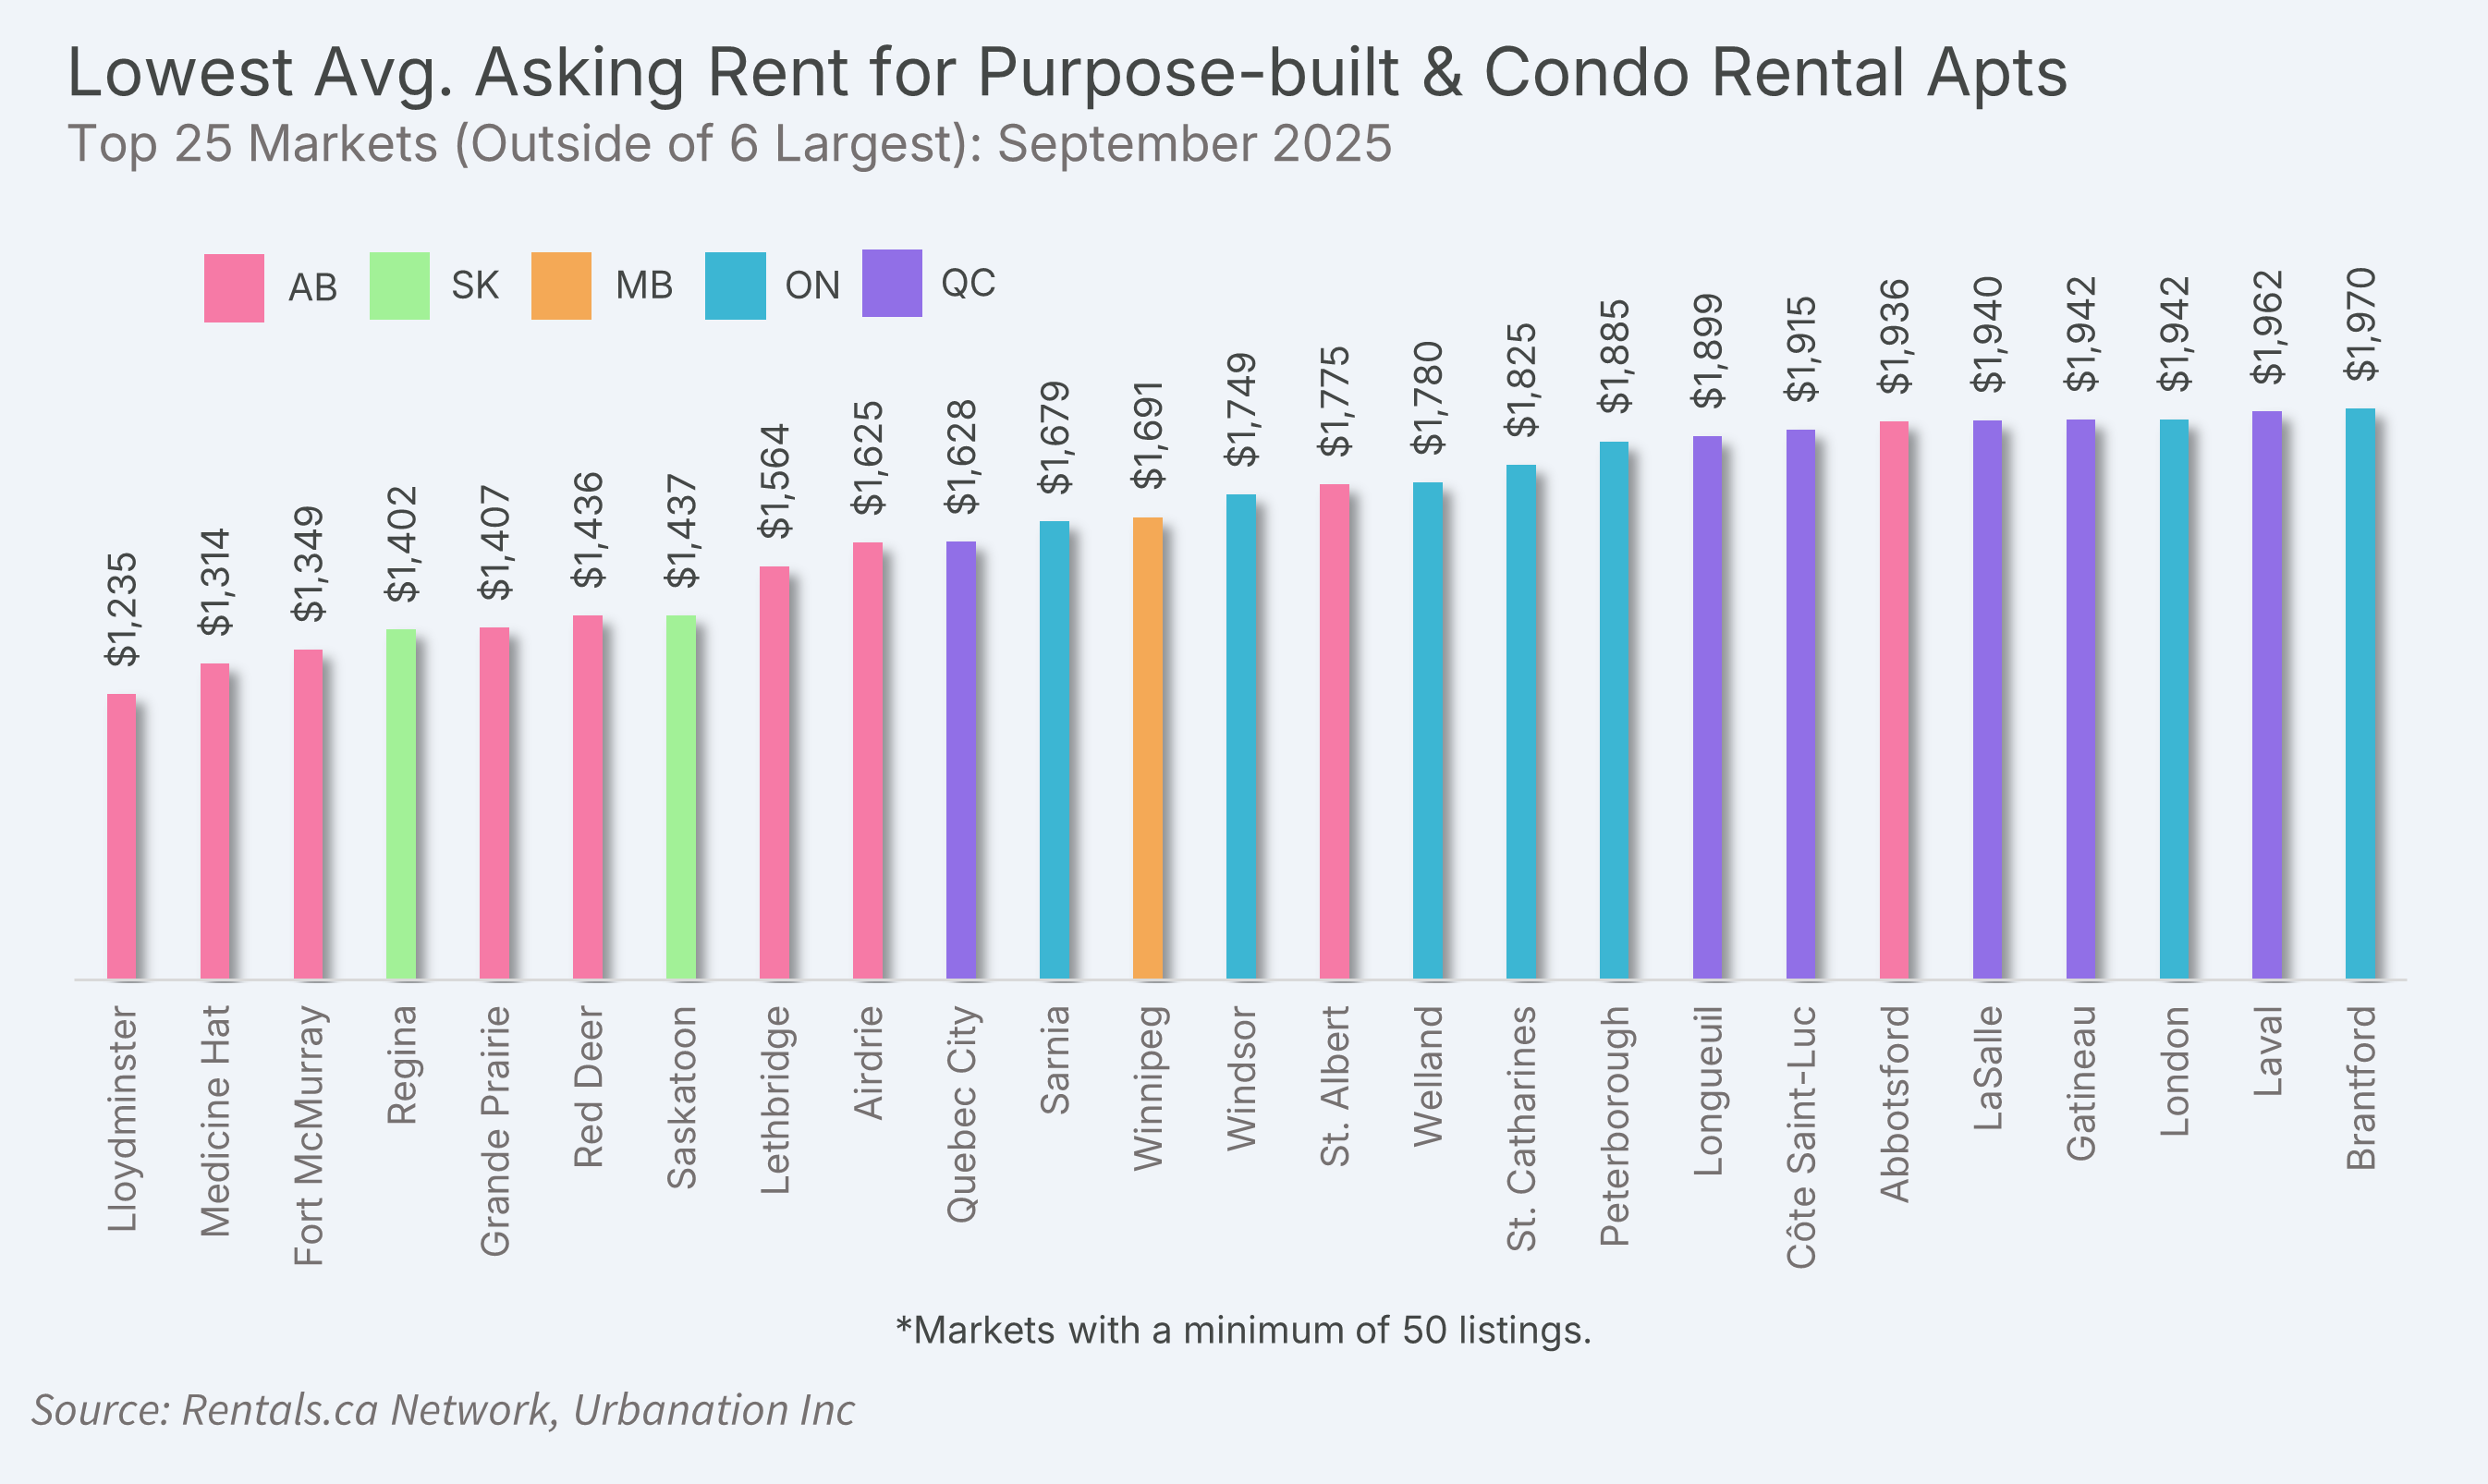
Seven of the 10 most affordable cities (outside of the six largest) were located in Alberta, led by Lloydminster ($1,235), Medicine Hat ($1,314), and Fort McMurray ($1,349). Outside of Alberta, the most affordable markets included Regina ($1,402), Saskatoon ($1,437), Quebec City ($1,628), Sarnia ($1,679), and Winnipeg ($1,691).
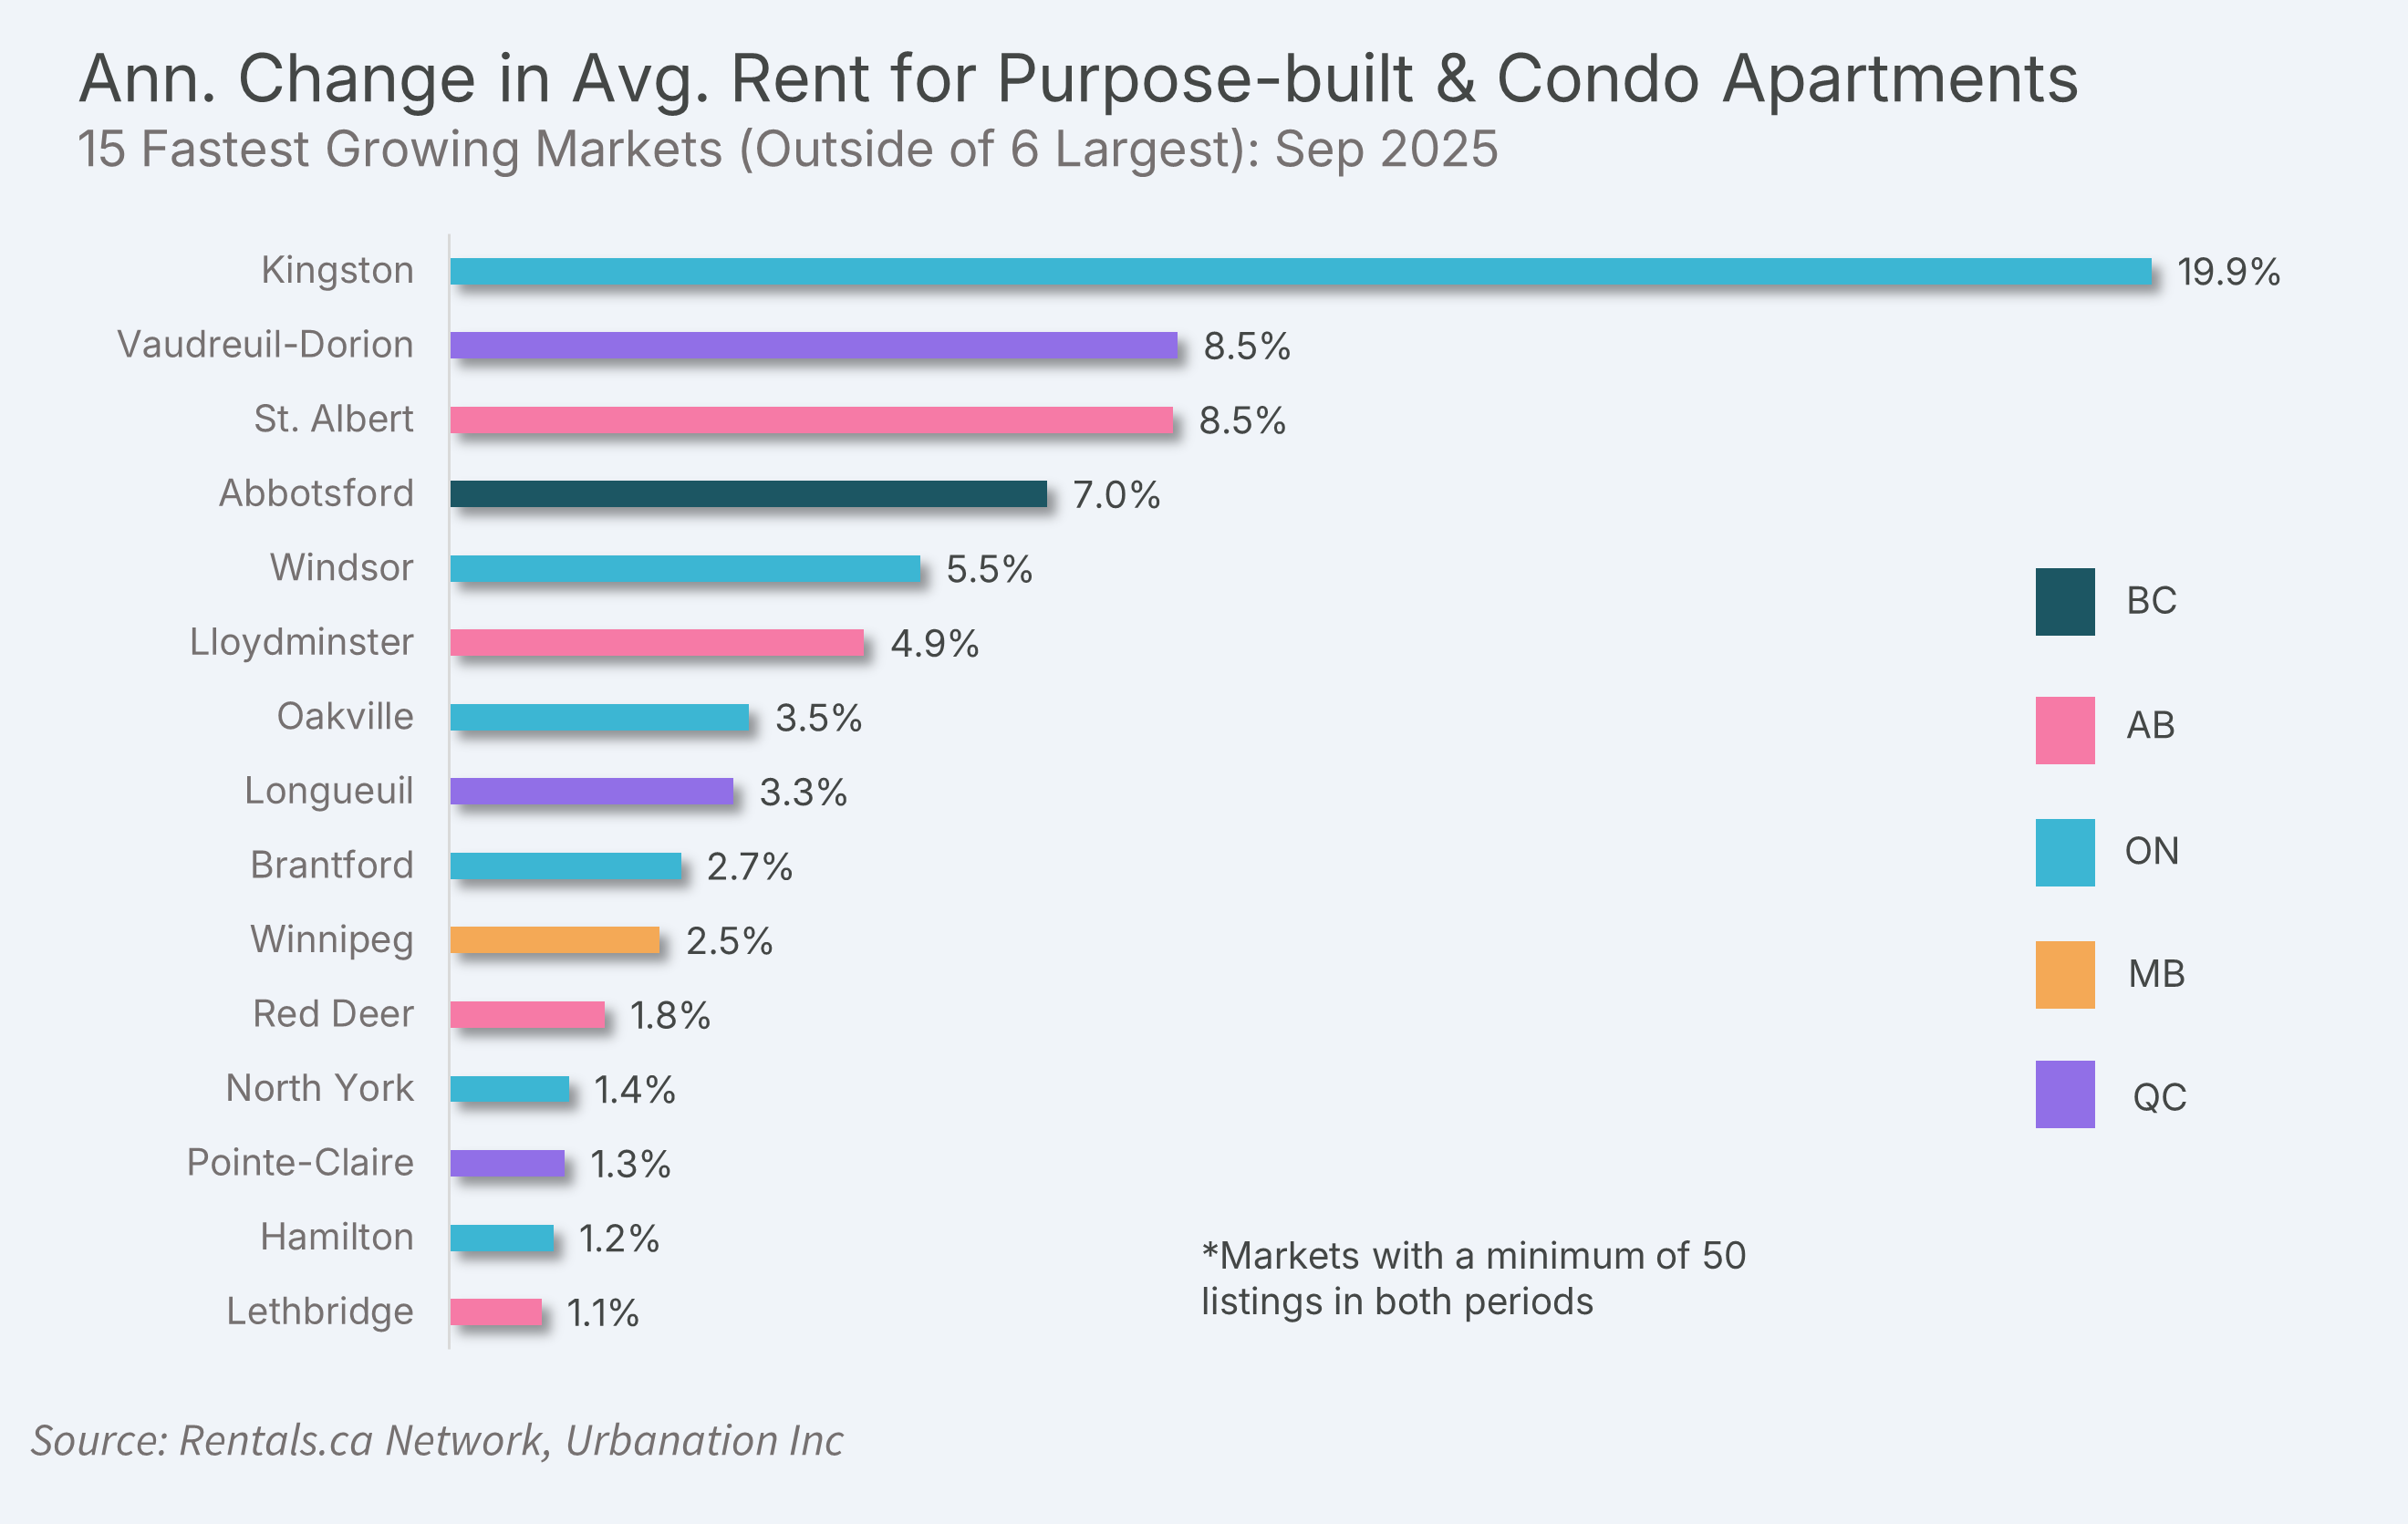
Kingston Tops Rent Growth in Canada
For the second straight month, Kingston had the fastest rising apartment rents with an annual growth of 19.9%. Following in second was Vaudreuil-Dorion and St. Albert, both with 8.5% rent growth, with Abbotsford (+7.0%) and Windsor (+5.5%) representing the only other cities that posted annual rent increases above 5%.
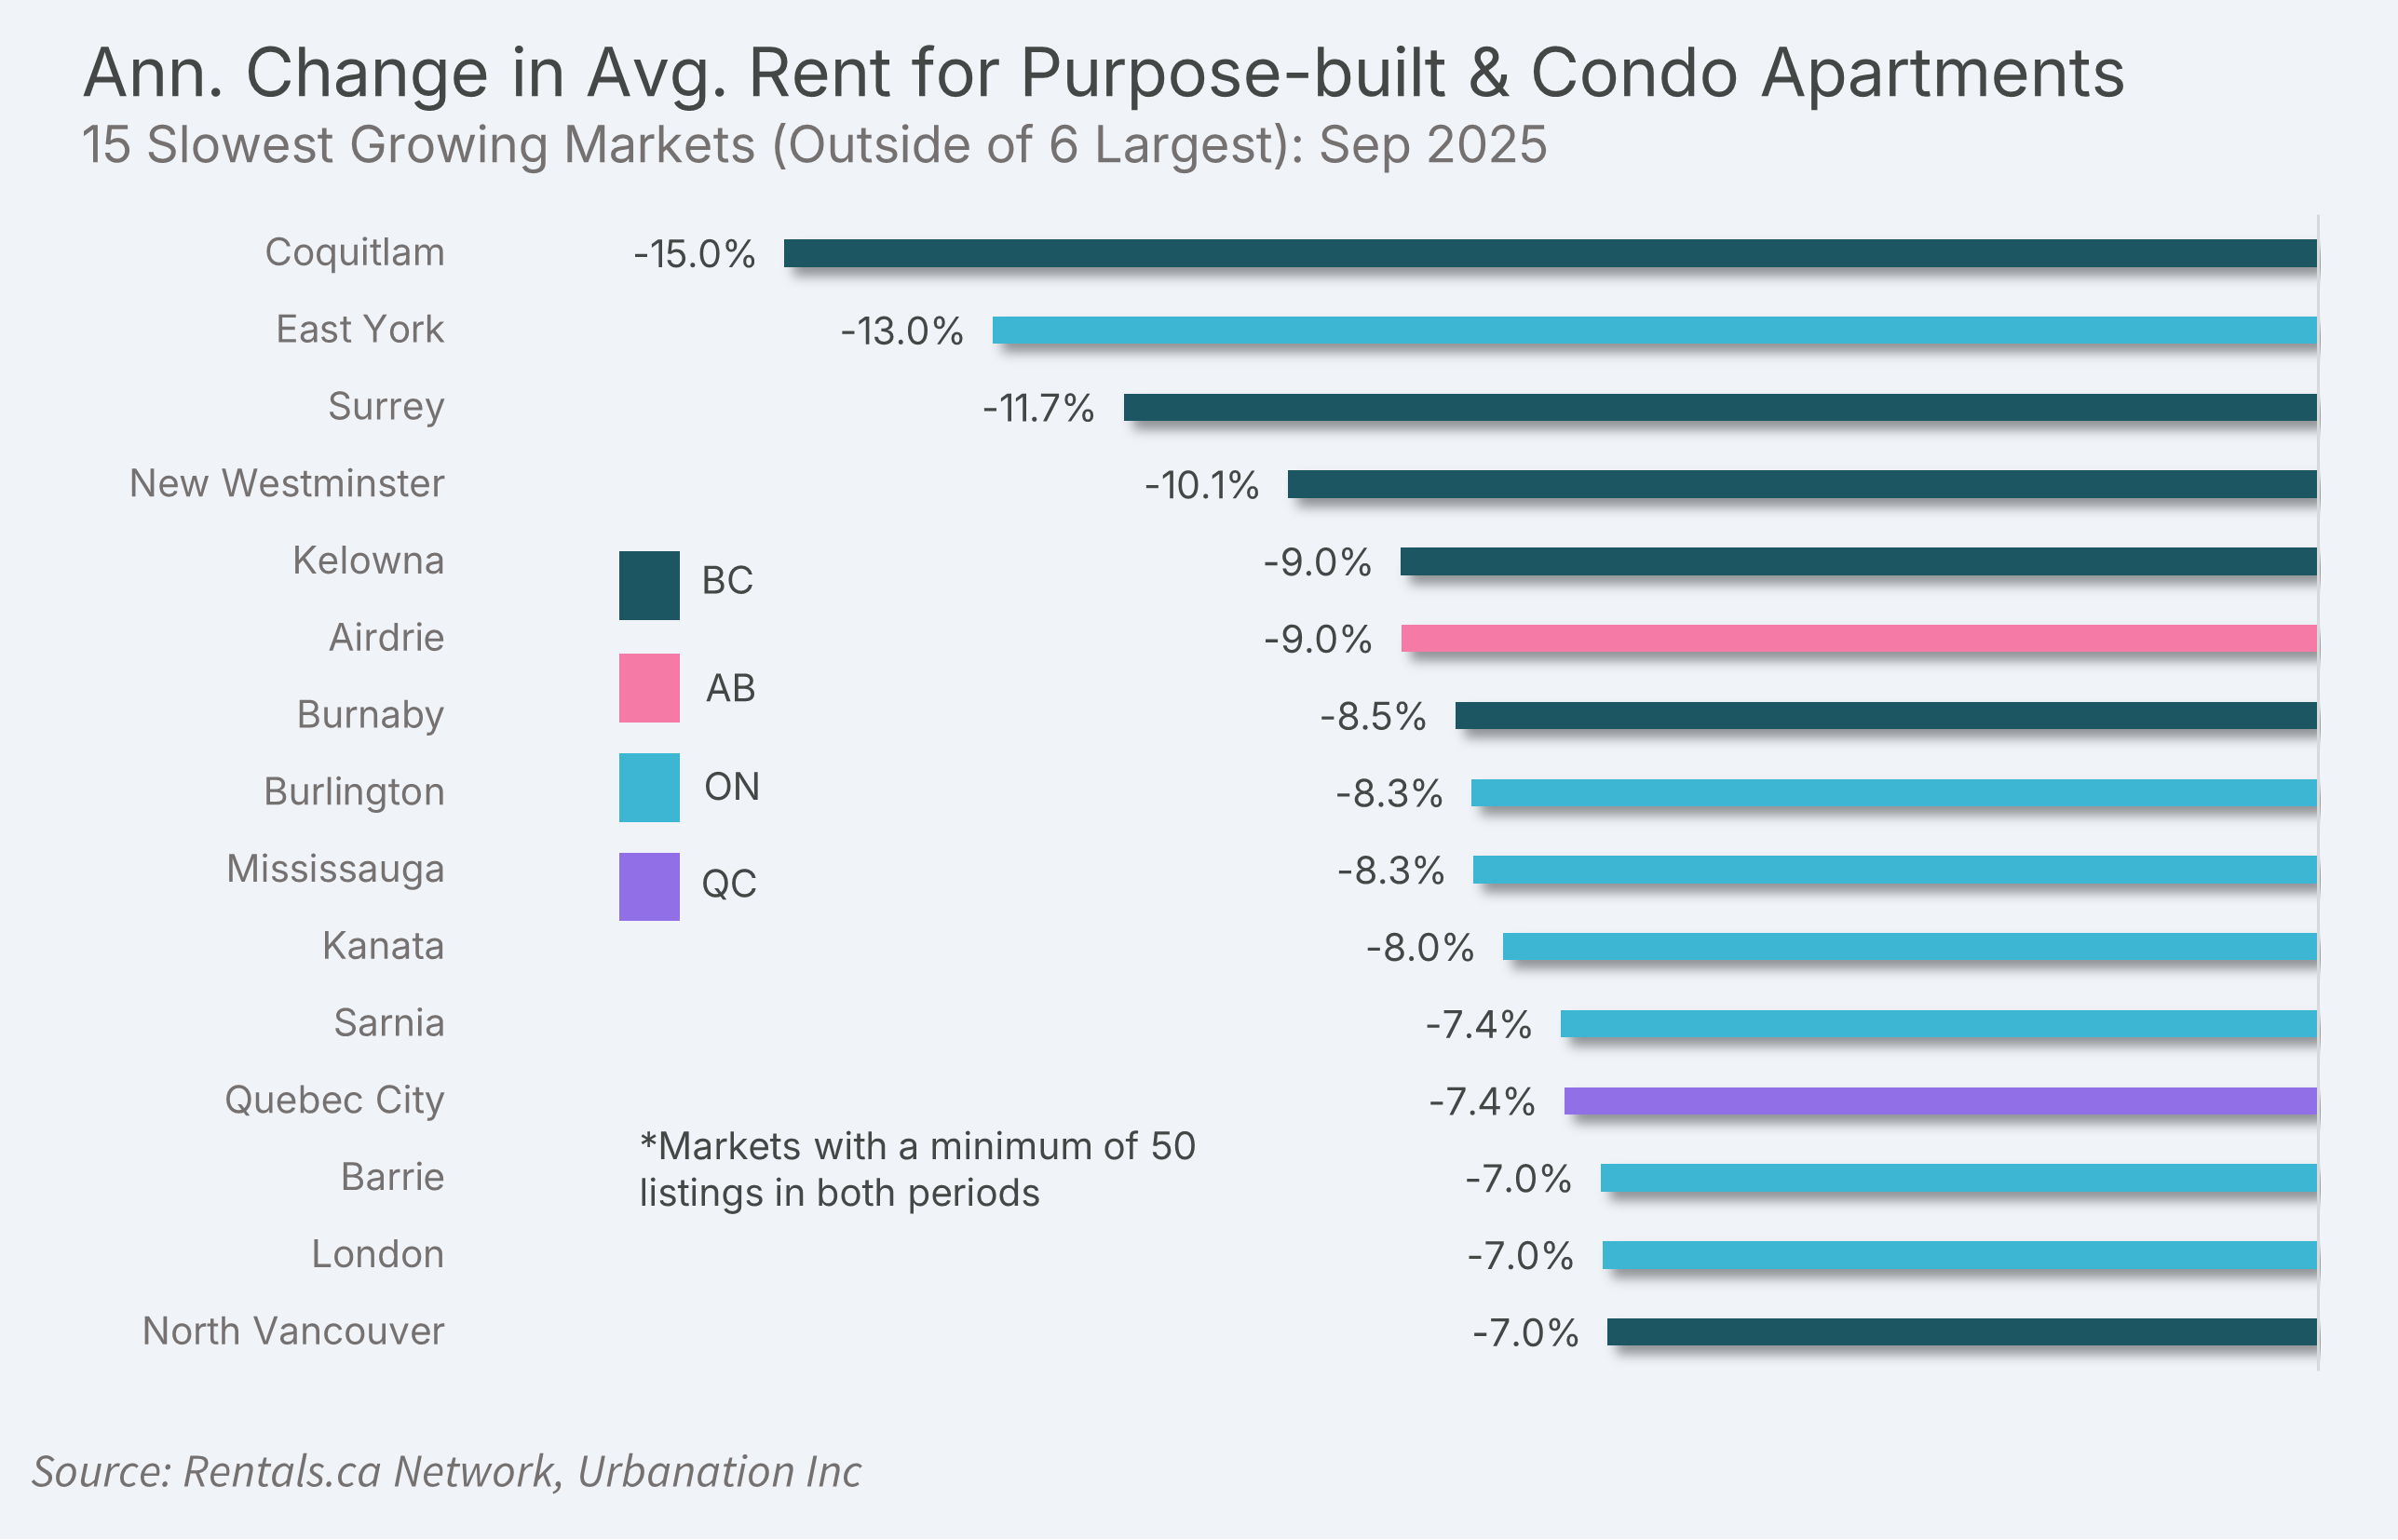
Four cities posted annual rent declines of more than 10% for apartments in September, three of which were located in B.C. and included Coquitlam (-15.0%), Surrey (-11.7%), and New Westminster (-10.1%). East York led rent declines in Ontario with a 13.0% annual decrease.
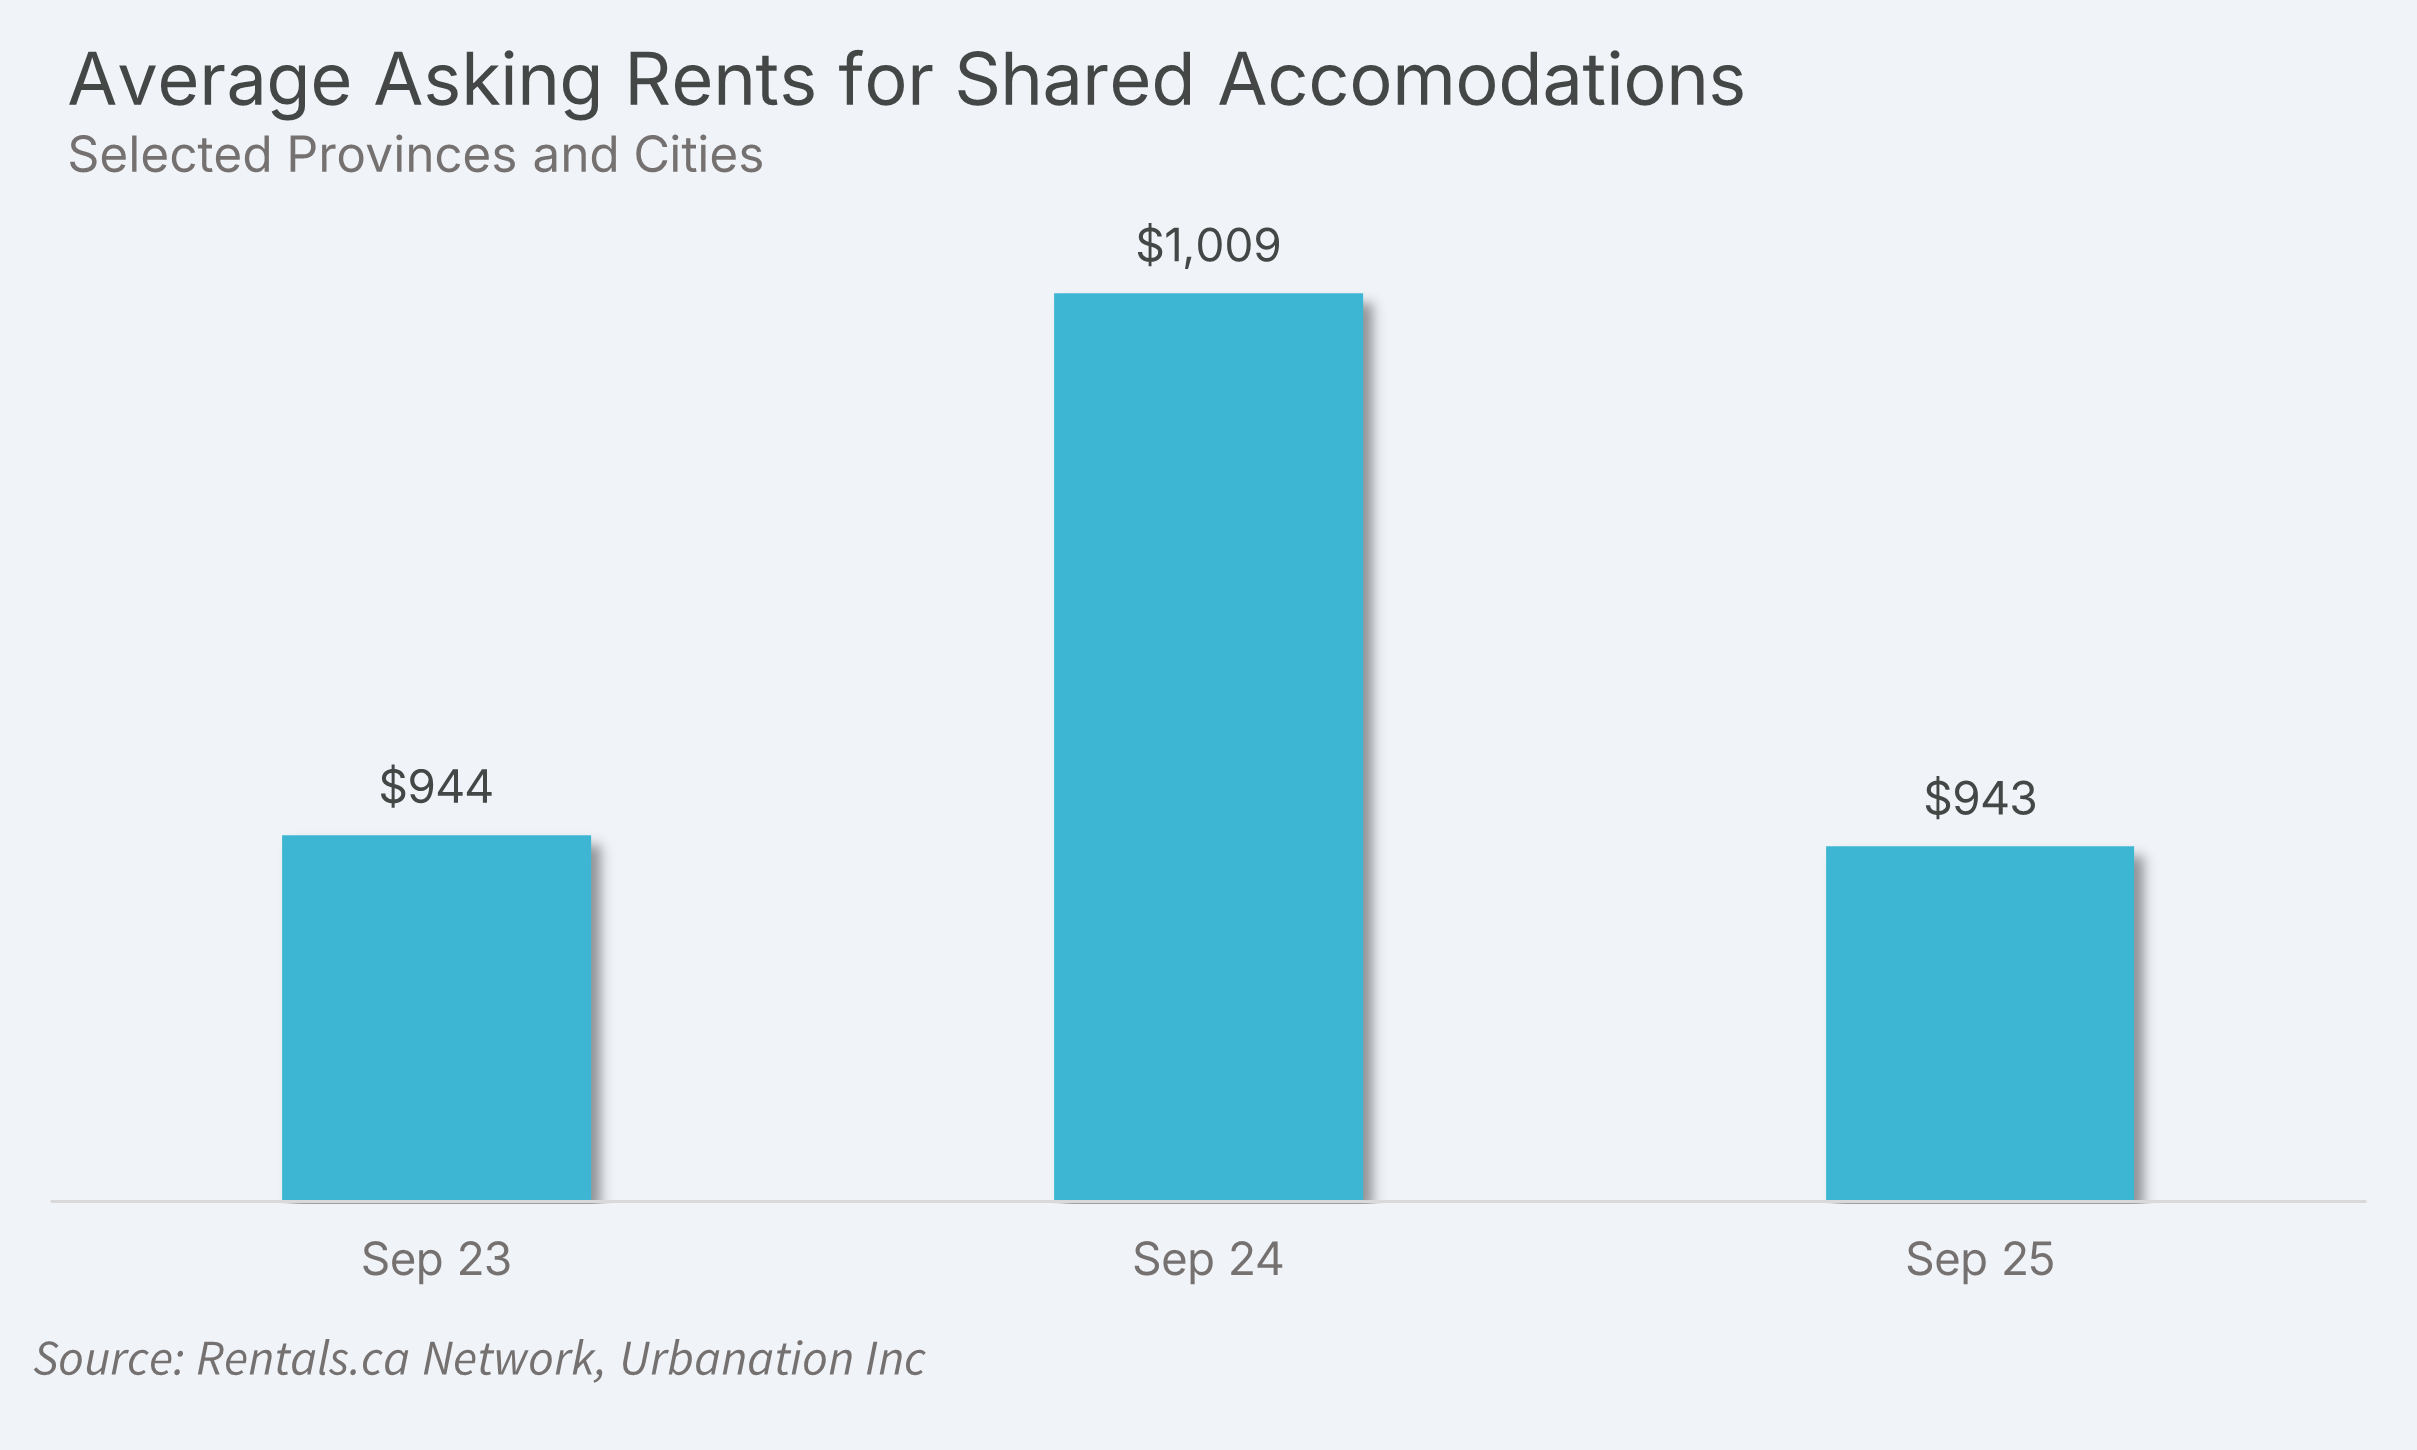
Shared Accommodation Rents in Vancouver Fall 15%
Asking rents for shared accommodations in B.C., Alberta, Ontario and Quebec reached an average of $943 in September, declining 6.6% from last year and effectively returning to the level from two years ago.
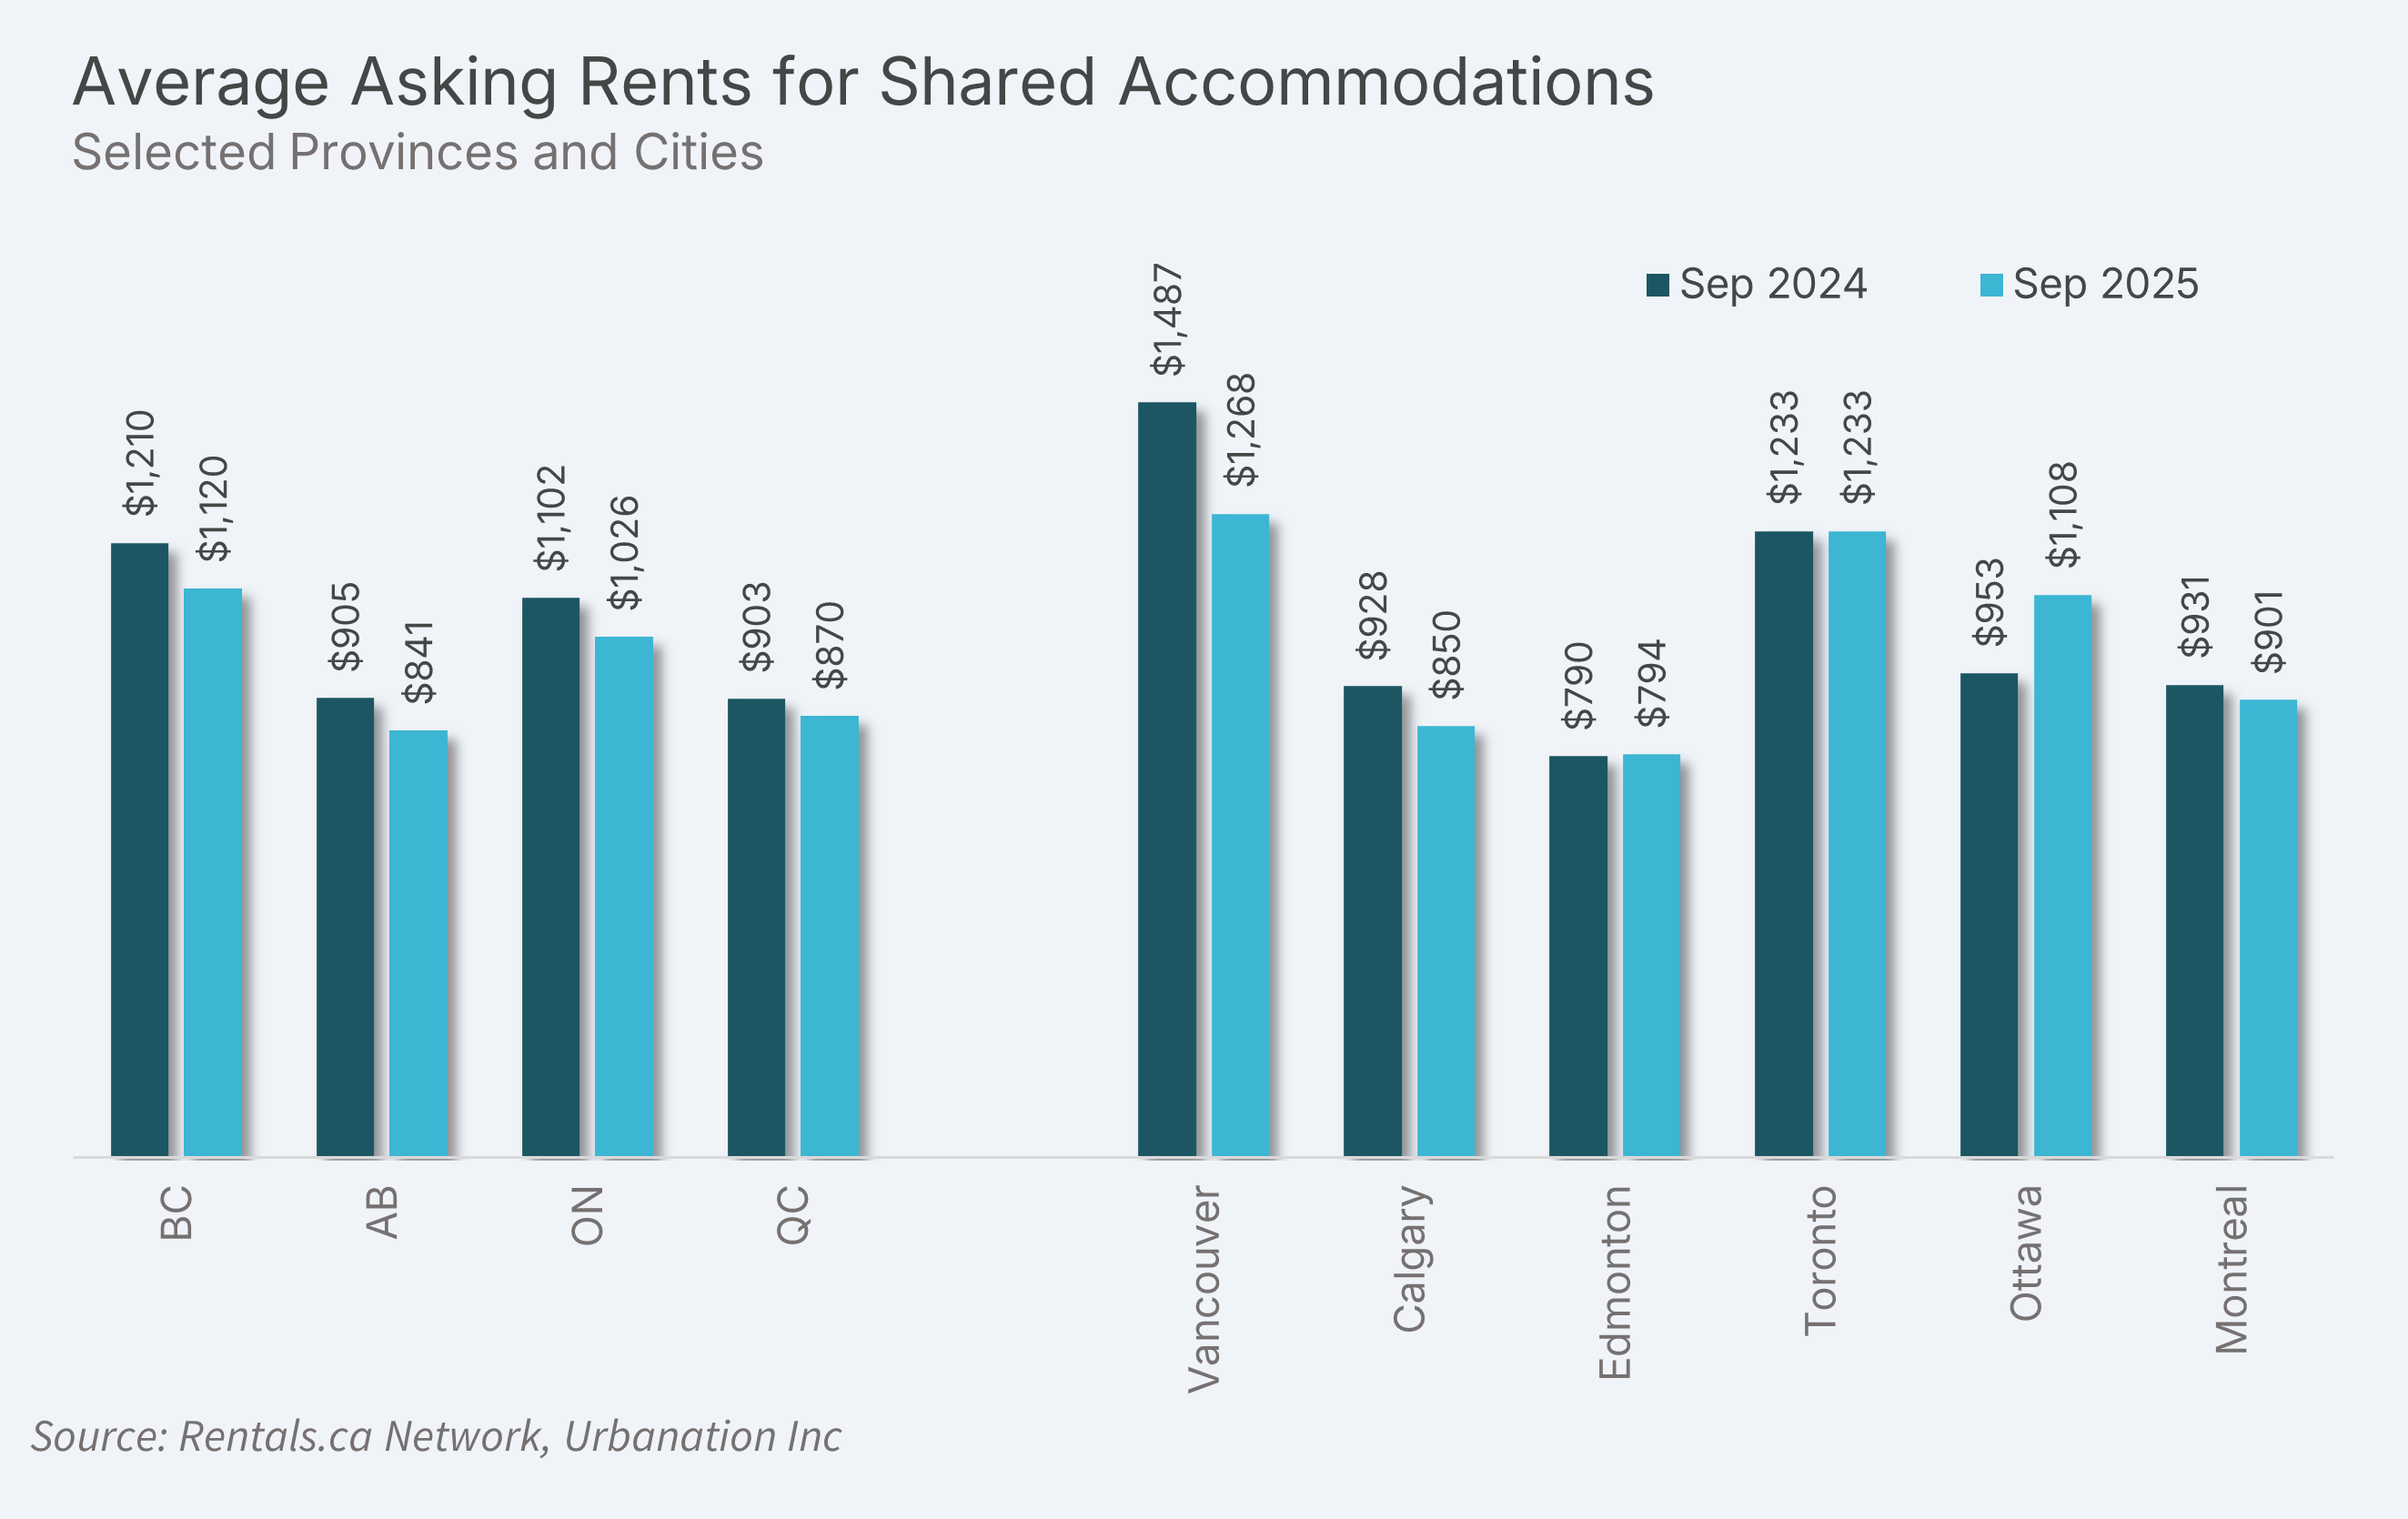
Annual declines for shared accommodation rents were reported across each of the four provinces tracked, led by a 7.4% decrease in B.C to an average of $1,120 and a 7.1% decrease in Alberta to an average of $841. Shared accommodation rents declined 6.9% annually in Ontario to an average of $1,026, while holding up better in Quebec with a 3.7% annual decline to an average of $870.
By city, shared accommodation rents in Vancouver dropped 14.7% year-over-year to an average of $1,268, while Calgary rents fell 8.4% to an average of $850 and Montreal rents declined 3.2% to an average of $901. In Toronto, shared accommodation rents were unchanged from last year at $1,233, while edging up by 0.5% in Edmonton to $794 and rising 16.2% in Ottawa to $1,108.
You can check out the previous rent reports here
Rentals.ca Data
The data used in this analysis is based on monthly listings from the Rentals.ca Network of Internet Listings Services (ILS). This data differs from the numbers collected and published by the Canada Mortgage Housing Corporation (CMHC).
The Rentals.ca Network of ILS’s data covers both the primary and secondary rental markets and includes basement apartments, rental apartments, condominium apartments, townhouses, semi-detached houses, and single-detached houses. CMHC’s primary rental data only includes purpose-built rental apartments and rental townhouses. CMHC also collects data on secondary market rentals, but this is reported separately.
CMHC’s rental rates are based on the entire universe of purpose-built rental units (rental stock), regardless of rental tenure. CMHC rental rates are reflective of what the average household spends on rental housing and not the current market rents for vacant units. The data used in this report is based on the asking rates of available (vacant) units only and reflect on-going trends in the market. This covers a smaller sample size but is more representative of the actual market rent a prospective tenant would encounter. The Rentals.ca Network of ILS’s data typically provides much higher rental rates compared to CMHC, as vacant units typically reset to market rates when not subject to rent control.
The average and median rental rates in this report can also skew higher than CMHC’s data for the following reasons: the inclusion of larger more expensive unit types such as single-family homes, townhouse units, and large luxury condominium units; the presence of duplicate or multiple listings at the same property and the survivorship bias where more expensive or over-priced units take longer to lease and remain in the sample longer.
Properties listed for greater than $5,000 per month, and less than $500 per month are removed from the sample. Similarly, short-term rentals, single-room rentals, and furnished suites are removed from the sample when identifiable.

Rentals.ca is Canada’s premier online marketplace for renters and landlords, providing a comprehensive suite of tools and resources tailored to simplify the rental process. With an extensive selection of listings across the country, Rentals.ca offers user-friendly search functionality that helps renters find their perfect home efficiently. For landlords, Rentals.ca delivers effective advertising solutions to maximize visibility and fill vacancies faster. Committed to innovation and excellence, Rentals.ca aims to empower users with up-to-date market insights and expert guidance, making renting easier and more accessible for everyone.