

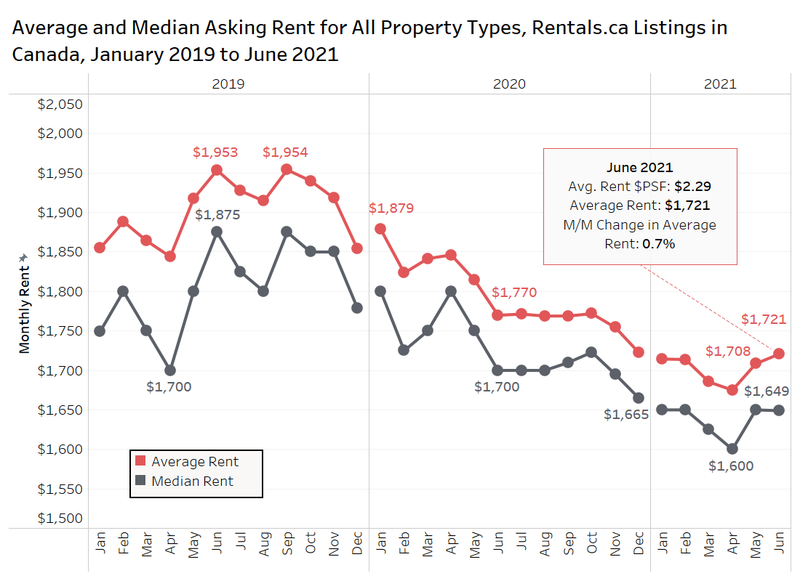
The average rent for all property types listed on Rentals.ca across Canada was $1,721 per month in June 2021. This represents a month-over-month increase of 0.7%, while also representing an annual decrease of 2.7%. The median rent in June 2021 was $1,649 per month, which represents a year-over-year decrease of 3.0%.
Rentals.ca July 2021 Rent Report
Rentals.ca July 2021 Rent Report
1. National Overview
After many months of decline following a late 2019 peak, the average monthly rent hit a low of $1,675 in April 2021, and has been steadily increasing since.
Average Rent Per Square Foot by Quarter
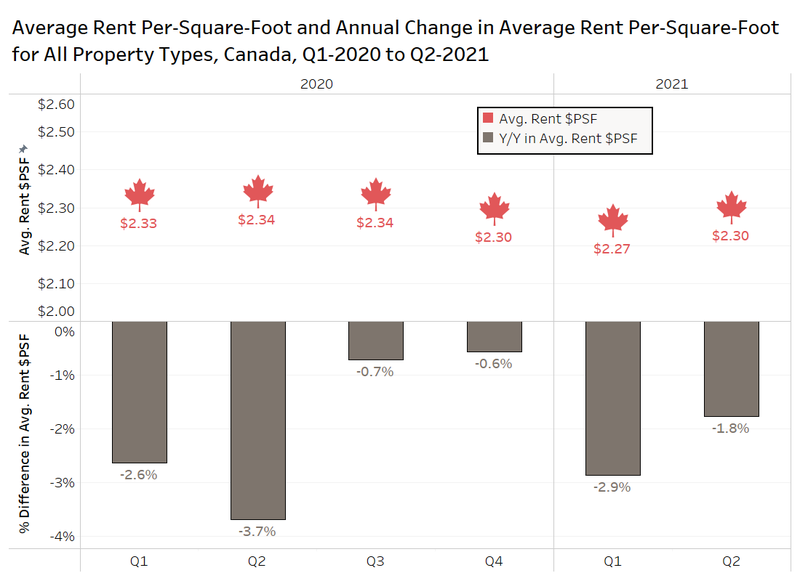
The chart below shows the average rent per square foot for all properties listed on Rentals.ca in Canada on a quarterly basis from Q1-2020 to Q2-2021 (top panel) and the annual percentage change in the bottom panel.
In Q2-2021, the average rent per square foot was $2.30 (i.e., a 1,000-square-foot-unit would be offered at $2,300 per month). The first quarter figure is up 1.3% quarterly, but down 1.8% annually.
There has not been a big change in the per-square-foot rent over the last six quarters, but the Q2-2020 result was actually down 3.4% annually at the start of the pandemic.
It should be noted that not all properties have their unit sizes listed by the landlord or owner, and the listings that do tend to skew newer, so the result may be slightly higher than the actual figure.
 Average Rent by Property Type and Month
The chart below shows the average rent levels by property type in Canada from January 2020 to June 2021. Townhouses and basement apartments have been excluded due to the smaller sample sizes, which leads to higher monthly volatility.
Single-family homes have experienced the sharpest increase in average monthly rent since the start of 2021, moving from $2,214 per month up to $2,553 per month (an increase of 15%), but declined month over month. On an annual basis, the average rent in June is up 5.5% over June 2020.
The average monthly rental rate for condo and rental apartments have also both experienced increases since the start of 2021, albeit to a much lesser extent when compared to single-family homes. Condo apartments moved from $1,983 per month in January 2021 up to $2,032 per month in June 2021 (+2.5%), but are still down 8.3% year over year. Rental apartments have experienced rent inflation of 0.1% from $1,605 per month in January 2021 up to $1,608 per month in June 2021. On an annual basis, average rent is up 3.1% over June of 2020.
 Average Rent by Bedroom Type
The chart below looks at the average monthly rental rate from June 2020 to June 2021 organized by number of bedrooms (three-bedroom and larger units are grouped together).
Studio units moved from $1,332 per month in June 2020 down to $1,258 per month in January 2021 — a decline of 5.6%. Since then, the average monthly rental rate has increased 1% up to $1,271 per month in June 2021 (but remains down year over year).
One-bedroom units followed a similar trajectory, declining 5.5% from $1,626 per month in June 2020 down to $1,537 per month in January 2021. The average monthly rental rate has since remained relatively constant, slightly declining from $1,537 per month to $1,532 per month in June 2021.
Two-bedroom units have seen their average monthly rental rate move from $1,907 per month in June 2020 down to $1,847 per month in January 2021, before slightly increasing again to $1,859 per month in June 2021.
 Units with three bedrooms or more saw their average monthly rental rate move from $2,336 in June 2020 down to $2,257 per month in January 2021, which represents a decline of 3.4%. Since then, units with three bedrooms and larger have experienced the sharpest increase out of all the segments, increasing 6.2% to $2,396 per month in June 2021 (up 2.6% annually).
Rent Per Square Foot by Rounded Unit Size
The chart below shows the average rent per square foot for all property types by rounded unit size in April, May, and June of 2020 and 2021. Units are rounded to the nearest 100, and include only units from 350 square feet to 1,549 square feet.
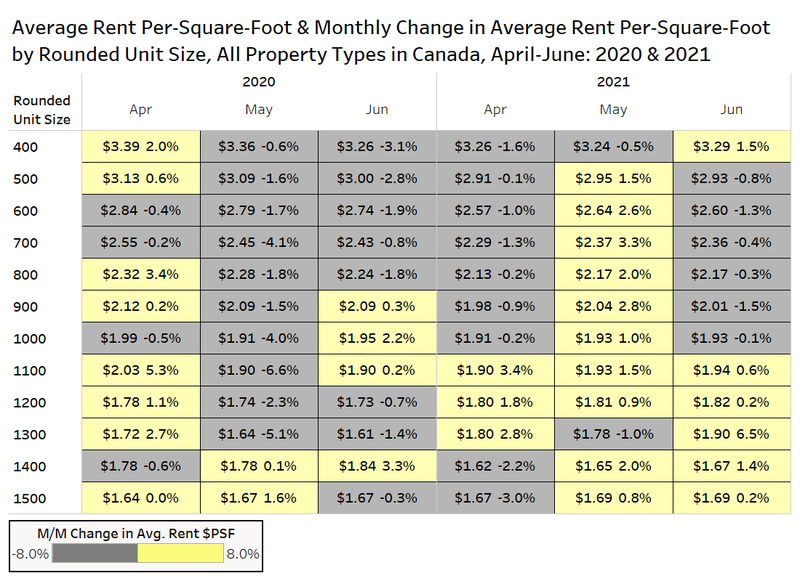 In April 2021, we can see that many unit-size segments experienced a slight month-over-month decline in average rental rates, with 1,100-square-foot, 1,200-square-foot, and 1,300-square-foot units experiencing increases. This changed in May, as the majority of the unit segments experienced month-over-month increases ranging from 0.8% (1,500-square-foot units) to 3.3% (700-square-foot units). June 2021 saw units between 500 square feet and 1,000 square feet experiencing small declines between 0.3% and 1.5%, while units between 1,100 square feet and 1,500 square feet experienced increases between 0.2% and 6.5%.
The 1,100-square-foot and 1,200-square-foot unit sizes are the only rounded sizes to experience increases in each of the last three months.
2. Provincial Rental Rates
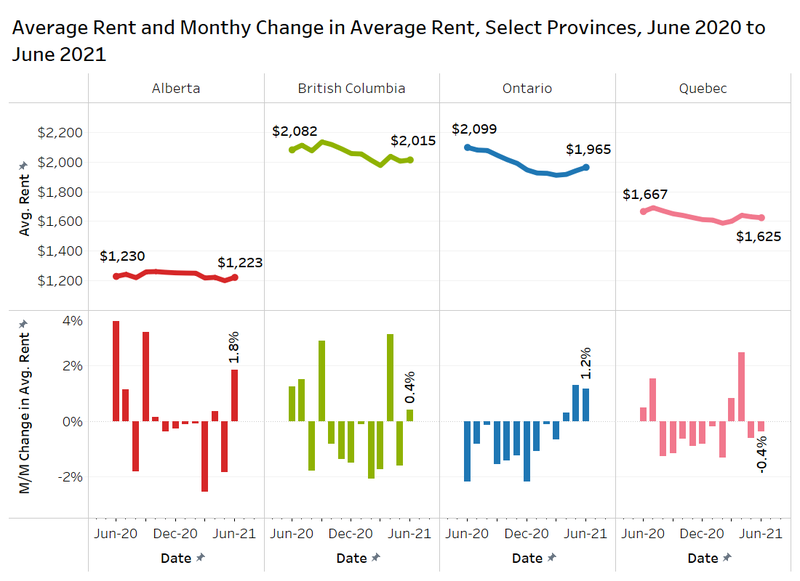
The following figure shows the average rent and the month-over-month change in average rent for Alberta, British Columbia, Ontario, and Quebec — which are the four provinces with the highest number of listings on Rentals.ca.
Alberta saw its average monthly rent increase by 1.8% to $1,223 per month in June 2021, British Columbia increased 0.4% to $2,015 per month in June 2021, Ontario increased 1.2% to $1,965 per month in June 2021 and Quebec declined 0.4% monthly to $1,626 per month.
Because Ontario has the most listings in the country, it had an outsized impact on the average rental rate on a national basis.
On an annual basis, all of the provinces have average rent below where they were in June of 2020.
 Average Rental Rates for All Property Types by Metropolitan Area
The average property listed for rent on Rentals.ca in June in the Vancouver Census Metropolitan Area (CMA) was offered at $2,152, which represents an annual decrease of 2.8%, but was $11 a month more than May 2021. The average per-square-foot rent in the Vancouver CMA was up 2.7% annually to $3.02, which reflects the greater number of small units on the market, as the average unit size declined from 827 square feet to 776 square feet. Tenants have flocked to larger apartments in locations farther from their place of employment during the pandemic.
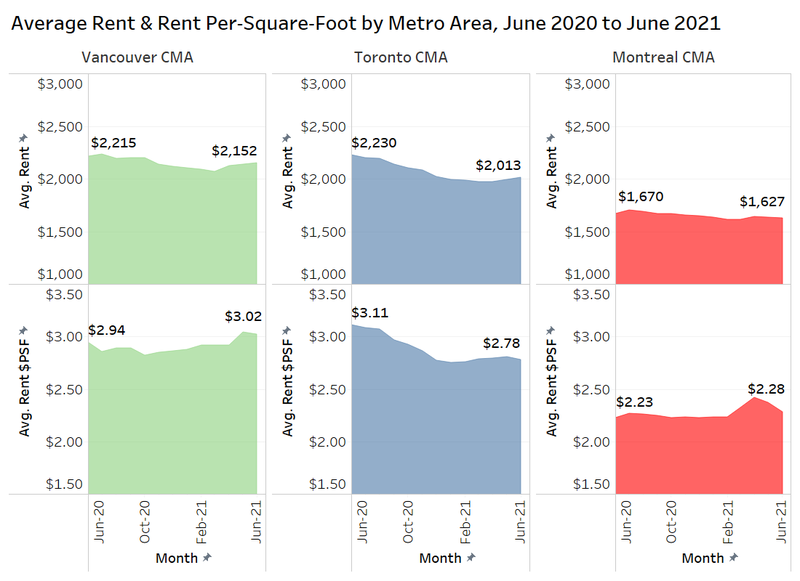 In the Toronto CMA, the average rent for all property types declined from $2,230 in June 2020 to $2,013 in June 2021, which is an annual decline of 9.7%. However, the average unit is $21 more expensive than a month earlier (+1.1%). Per-square-foot rent is down 10.6% year over year, moving from $3.11 per square feet down to $2.78 per square feet in June 2021.
In the Montreal CMA, the average rent declined 2.6% annually, moving from $1,670 per month in June of last year to $1,627 per month in June 2021. Rent on a per-square-foot basis increased 2.2% annually from $2.23 per square feet in June 2020 to $2.28 in June of this year. On a monthly basis, the average rent and average rent per square foot declined, while the average unit size increased from 780 square feet in May 2021 to 812 square feet in June 2021.
The average monthly rental rates for Vancouver and Toronto are rising throughout the late spring and early summer of 2021. With most of Canada opening up again, it is reasonable to expect this trend to continue in the near future as the population prepares to go back to the office, and the colleges and universities restart in-class learning.
3. Municipal Rental Rates
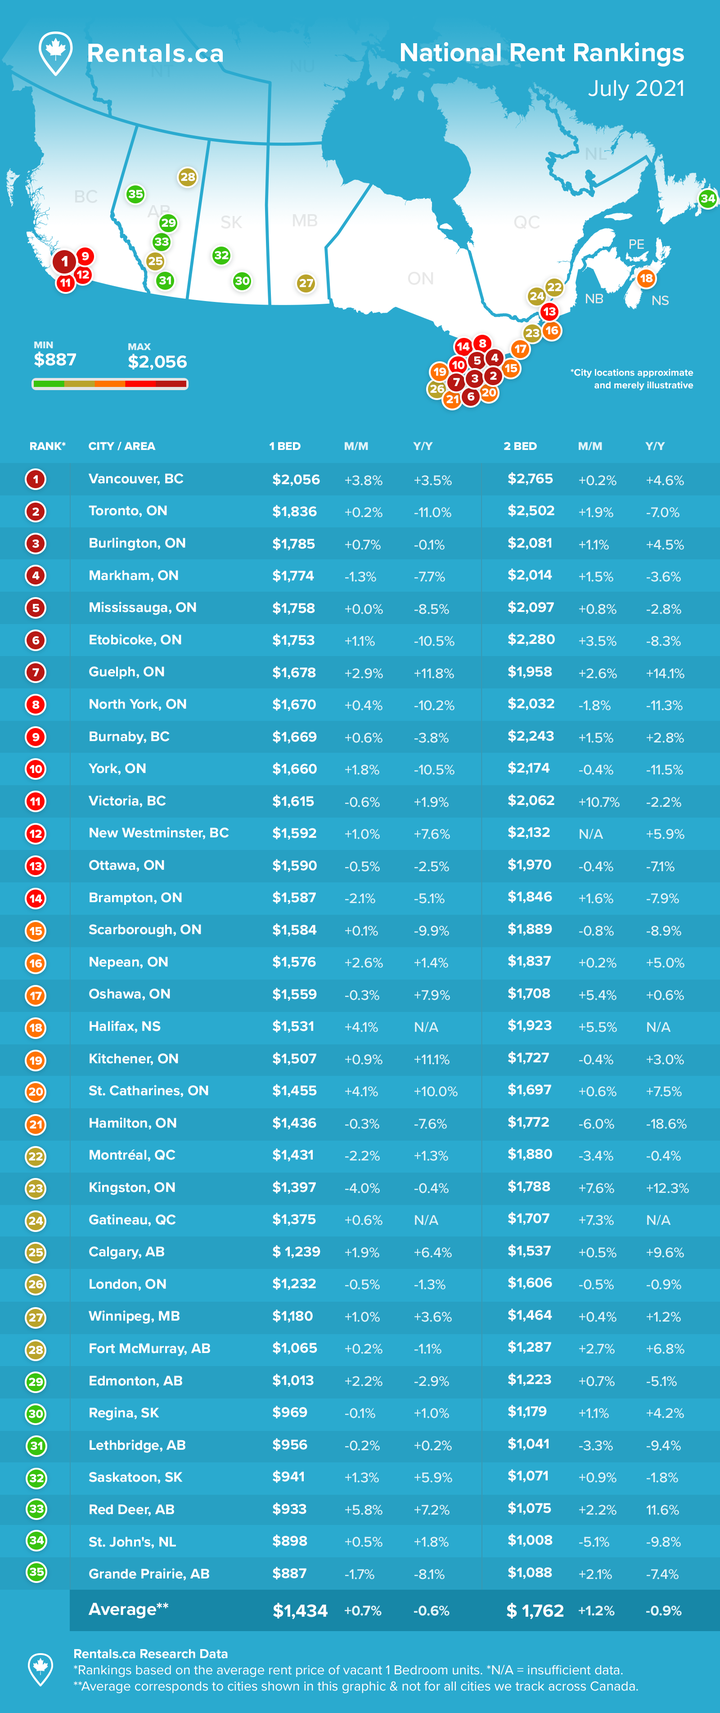
The chart below presents data on the average rental rates by municipality and area in Canada for June 2021, with the monthly percent change in average rent shown on the right.
 The largest increase was experienced by Halifax at 6.7%, settling at $1,731 per month in June. The largest month-over-month decline was experienced by Hamilton at 2.7%.
From the above figure, we can see that most of the cities have experienced a monthly increase in average rental rate, with only a handful of cities experiencing small declines ranging from 0.4% to 2.7%.
Average by Property Type in Calgary
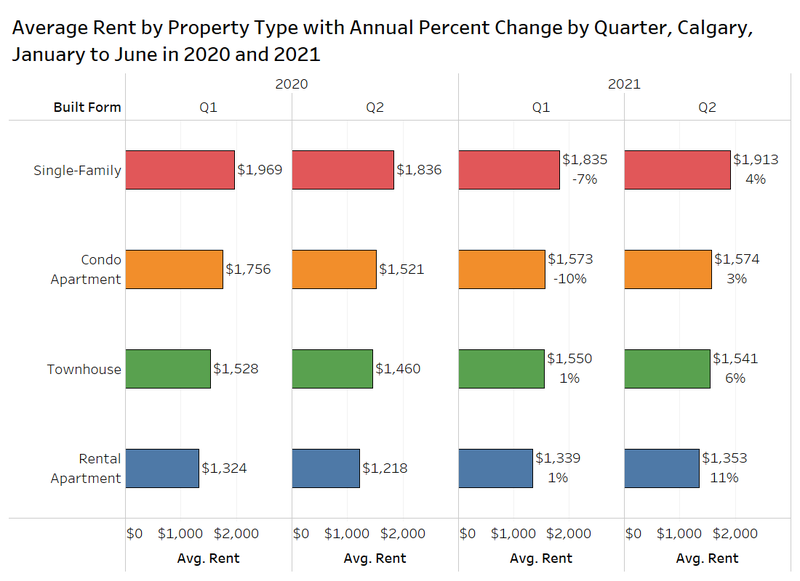
The following chart looks at the average rent in Calgary in the first and second quarters of 2020 and 2021.
When comparing the second quarter of 2021 versus Q2-2020, average rents have increased for all of the property types shown, with rental apartments growing by 11% annually.
However, the average rental rate for single-family homes of $1,913 per month in Q2-2021 is still below the pre-pandemic rate of $1,969 in Q1-2020. The same is true for condo apartments, with the Q2-2021 rate of $1,574 below the $1,756 rate from Q1-2020. Condo rentals in Calgary were the hardest hit in terms of rent declines(which was also the case in many other major Canadian cities).
Townhouse and rental apartment rates in Calgary in the second quarter of this year are now higher than the last quarter before the pandemic, with rental apartments now 2% higher than Q1-2020.
 Toronto by Neighbourhoods
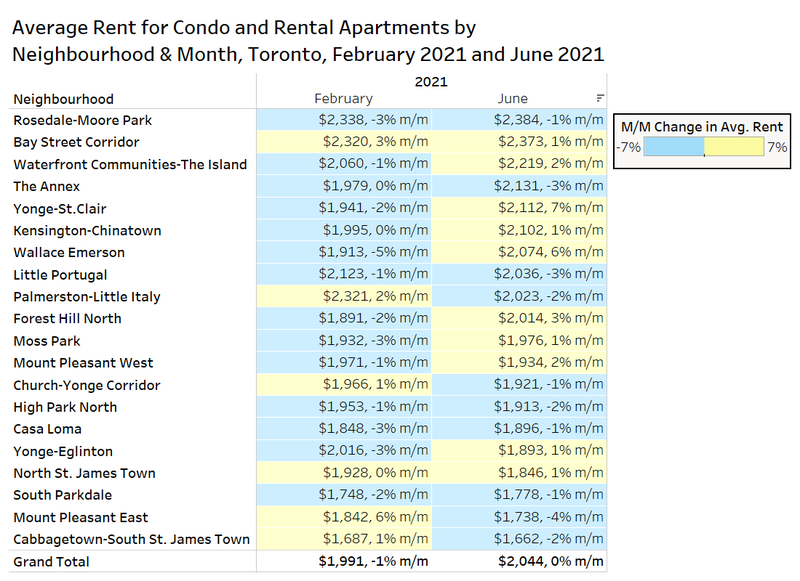
The chart below looks at the average rent and monthly change in average rent for the 20 most active Toronto neighbourhoods in terms of listing activity on Rentals.ca (condominium and rental apartments only). The data looks at the latest month, June 2021, versus the recent low point in the market, February 2021.
The top seven most expensive rental neighbourhoods in Toronto have all seen their rents increase in comparison to February, and 11 of the top 20 neighbourhoods have seen increases. The highest rent growth in June 2021 versus February 2021 was around 8% in Yonge-St. Clair, The Annex, The Waterfront Communities, and Wallace Emerson.
In terms of month-over-month increases, 10 neighbourhoods increased and 10 decreased in June, with an overall increase of 0.1%. The biggest increase in June 2021 over May 2021 was Yonge-St. Clair, with a 7% month-over-month increase.
4. Conclusion
The average rent in Canada increased for the second consecutive month, rising to $1,721 per month. However, this is still below the average rate generated via Rentals.ca listings in late 2018.
The single-family rental market remains strong, and rental apartment rents are now above pre-pandemic levels. The average rent for condos has started to turn up, but remains well below peak levels as the high-end downtown markets have yet to fully recover.
On a national basis, large units continue to outpace small units in terms of rent growth as many tenants anticipate working from home for longer, while others expect the move to remote work is permanent.
In Canada’s largest province, Ontario, average rents have trended up for three consecutive months, but were still about $135 per month cheaper on average than one year ago.
On a municipal basis, there was strong month-over-month growth in Calgary and Edmonton, as well as Regina and Saskatoon. Rent growth was also high in several GTA suburban cities. However, the highest monthly rent increase occurred in Halifax at 6.7% as many former Nova Scotians moved back to Halifax with the intention of keeping their out-of-province job. Vancouver and Victoria also experienced 2% to 3% month-over-month increases in average rent as tenants look to get into those two highly desirable markets.
As the country begins to open up, tenant demand is expected to pick up as well, and further growth is expected in 2021. We expect a much larger increase to be experienced in 2022, when most COVID restrictions are lifted, offices are open, and immigration is back to the high pre-pandemic levels.
Rentals.ca Data
The data used in this analysis is based on monthly listings from Rentals.ca. The data is much different than the more familiar numbers collected and published by Canada Mortgage Housing Corporation (CMHC).
Rentals.ca data includes basement apartments, rental apartments, condominium apartments, townhouses, semi-detached houses and single-detached houses, where CMHC’s primary rental data only includes rental apartments and rental townhouses. CMHC collects some data on the secondary market, but it is reported separately.
The CMHC rental rates are based on the entire universe of purpose-built rental units in Canada (the stock), while Rentals.ca data is primarily based on the asking rents of vacated units only (the flow) — this is a smaller sample size, but more representative of the actual market rent a prospective tenant encounters. The Rentals.ca data set typically produces much higher rental rates in comparison to CMHC, as vacated units are not subject to rent control.
The average and median rental rates via Rentals.ca can also skew higher than CMHC’s data for several reasons: The inclusion of larger and more expensive unit types like singles, row units and condos; the survivorship bias (overpriced units remain in the sample longer); and the multiple listings of the same property at different rent levels every month.
It should also be noted that properties listed for above $5,000 a month and below $500 a month are eliminated from the sample of units analyzed. Also, short-term leases, single-room rentals, and furnished rental units are eliminated from the sample where identifiable.

Rentals.ca is Canada’s premier online marketplace for renters and landlords, providing a comprehensive suite of tools and resources tailored to simplify the rental process. With an extensive selection of listings across the country, Rentals.ca offers user-friendly search functionality that helps renters find their perfect home efficiently. For landlords, Rentals.ca delivers effective advertising solutions to maximize visibility and fill vacancies faster. Committed to innovation and excellence, Rentals.ca aims to empower users with up-to-date market insights and expert guidance, making renting easier and more accessible for everyone.