

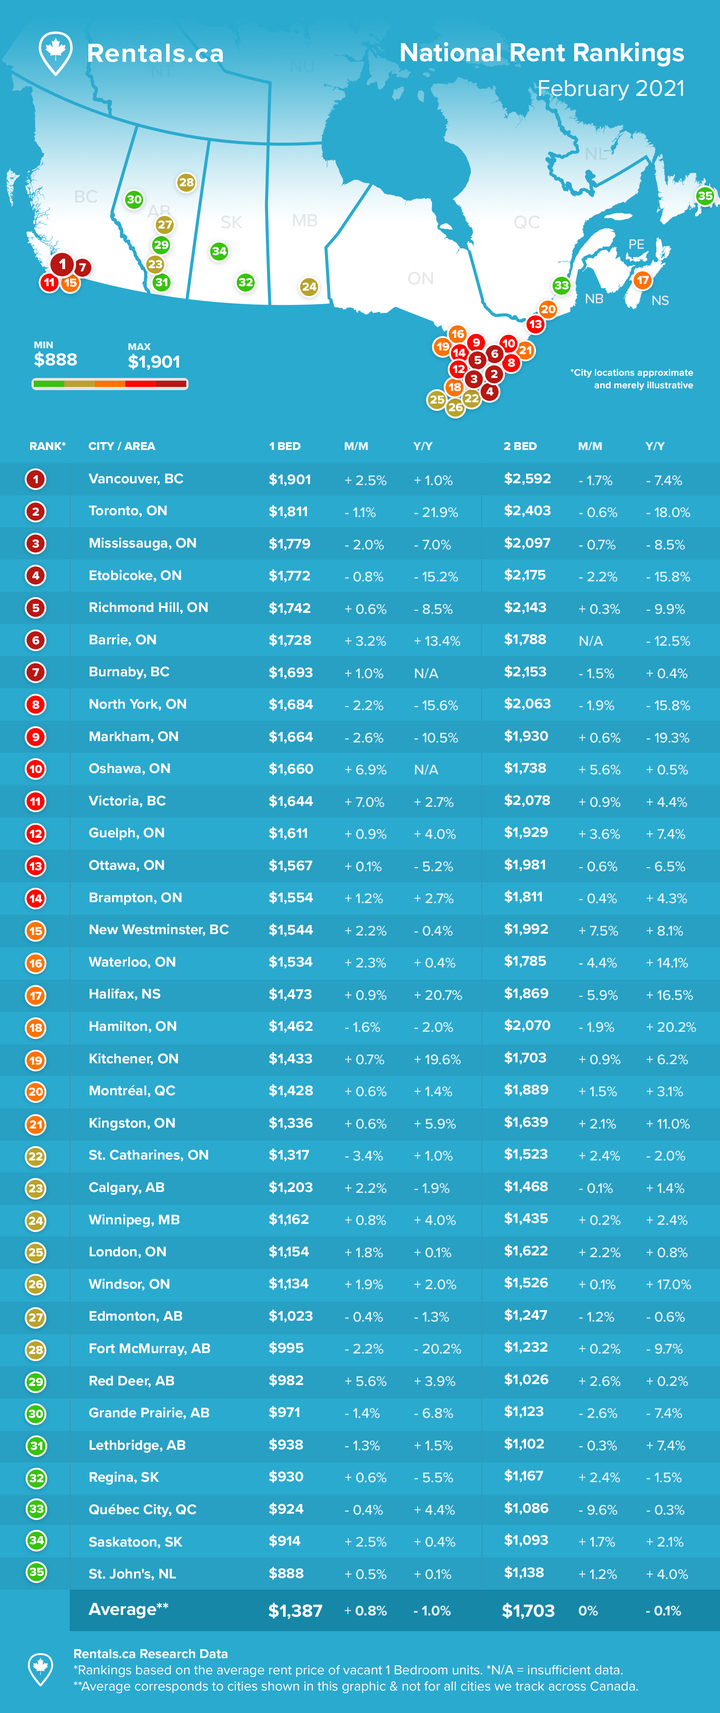
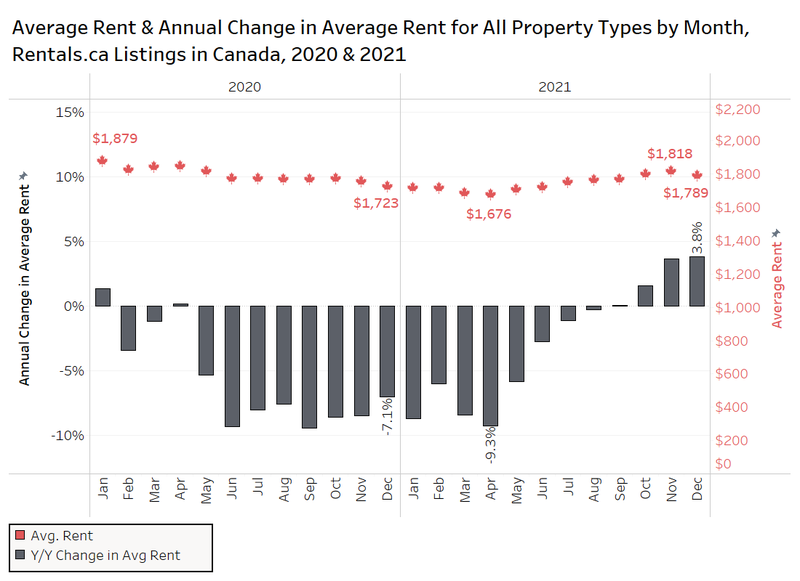
The average rent for all Canadian properties listed on Rentals.ca in January of 2021 was $1,714 per month, down 8.7% annually. The Canadian rental market continued its downtrend to start the new year. The January 2021 decline is slightly worse than the average decline in the second half of 2020 of 8.5%. On a monthly basis, rent was down 0.5% from $1,723 per month.
National Overview
 National Rental Rates Per-Square-Foot by Quarter
The figure below illustrates the average monthly asking rent per square foot for single-family houses, townhouses, rental apartments, condominium apartments, and basements apartments cumulatively from January 2020 to January 2021 by quarter.
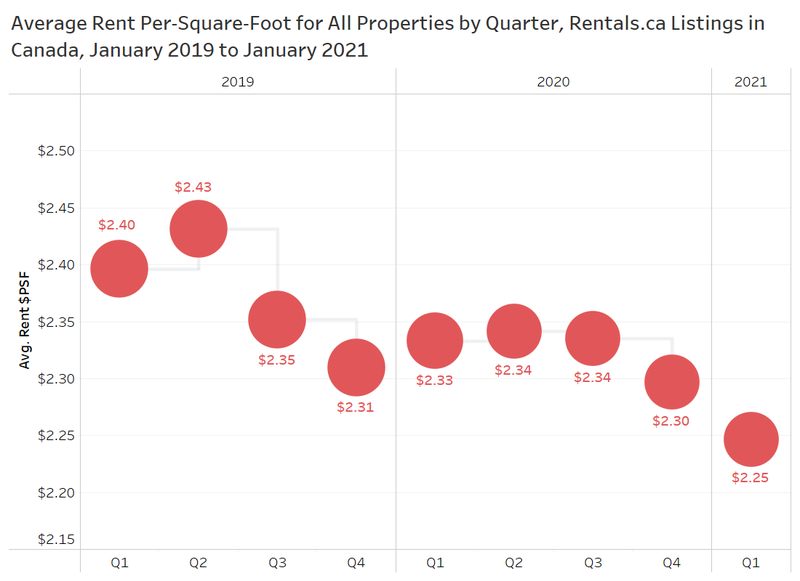 The average rent per square foot (psf) has slowly declined since 2019. After staying flat for the first three quarters of 2020 at about $2.34 psf, there was a slight decline to $2.30 in the fourth quarter. The subtle downtrend continued in the first quarter of 2021 (January only) as the average rent declined 3.4% annually to $2.25.
Average Unit Size Overall and By Property Type
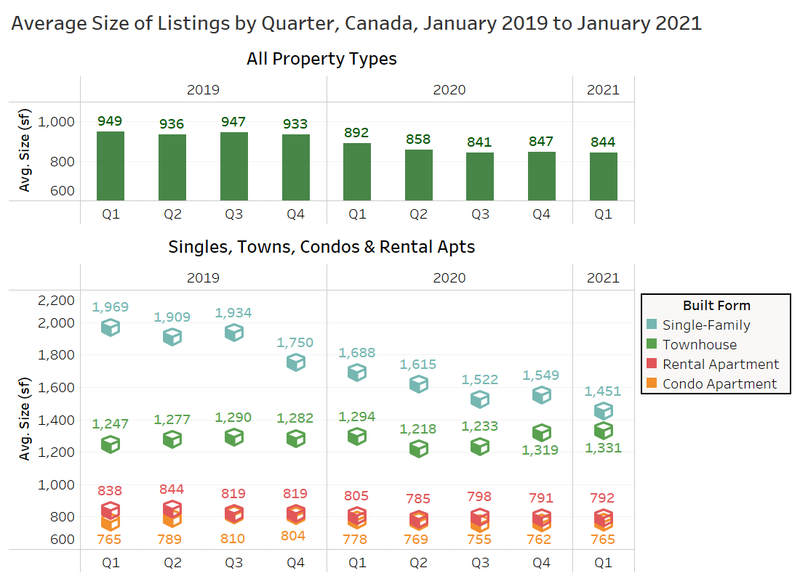
The next figure shows the average unit size for all property types in Canada via Rentals.ca listings (top panel), with the average size for single-family, townhouse, condo apartments and rental apartments in the bottom panel.
Not all owners/landlords make their unit size available, and those that do tend to skew toward newer properties, which skews the results small for condominium and rental apartments. We can see that the average unit size in Q1-2021 was 844 square feet (sf), a 5.4% decline from a year earlier.
The average size of single-family homes for rent on Rentals.ca has really decreased over the past two years. The average size was 1,969 sf in Q1-2019, dropping to 1,688 sf in Q1-2020, and falling 14% to 1,451 sf in Q1-2021.
 Rental Rates by Property Type
The chart below shows the average monthly rental rates, as well as the average rental rate per square foot for single-family homes, condominium apartments, and rental apartments for the January 2020 to January 2021 period. The colours represent the median rent.
 The average rental rate for a single-family home in January 2021 was $2,215, down 15% from the previous January’s average rent of $2,607. Condominium apartments in January 2021 experienced a decline of 19% from the previous year to $1,988 per month.
The average rental rates for rental apartments have not experienced the same large declines as the other major property types, showing a 5% increase over January 2020 to $1,604 per month.
Provincial Rental Rates
The chart below presents data on the average rent and average rent per square foot for all property types by province via Rentals.ca listings.
British Columbia, Ontario and the Northwest Territories had the highest average rent as well as the highest average rent per square foot. Newfoundland and Saskatchewan had the lowest average rental rates at just $1,010 and $1,011 per month.
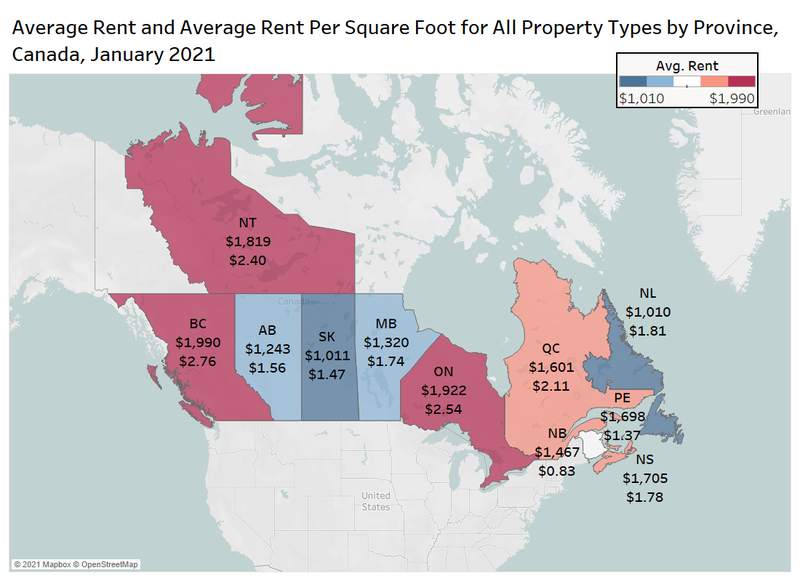 Over the course of the past year, the average rent for condominium and rental apartments in Ontario (red line) has steadily declined, falling by over 16% from January 2020. This notable drop is the largest out of all the major provinces.
British Columbia rents for condos and rental apartments increased by 8.3% annually, surpassing Ontario as the most expensive province in September of last year.
Rents in Manitoba and Alberta have been relatively flat year over year, while Saskatchewan is down by 1.7% from January 2020 to January 2021.
 Average Rent by Property Type in British Columbia, Alberta, Ontario and Quebec
The chart below looks at the average rent in January 2020 and January 2021 for single-family, condominium apartment and rental apartment property types in Ontario, British Columbia, Quebec, and Alberta based on the listings data from Rentals.ca.
 The average rent for single-family homes and condominium apartments in all four provinces declined in January 2021 compared to a year earlier. Single-family homes for rent were 18% cheaper in January of this year compared to January of last year.
Ontario suffered the largest decrease year over year for condo apartments, with the average rent falling by 19% annually.
Despite the pandemic, rental apartments in British Columbia and Quebec experienced double-digit increases in average rent for rental apartments. Alberta rental apartment rates were virtually unchanged year over year, while Ontario dropped 8% annually. However, apartment landlords are likely to be offering rental incentives to attract renters to a project, which is not net-out of the data presented here.
Municipal Rental Rates
Annual Change in Rent for Top Municipalities in Canada for Condo and Rental Apartments
This next chart shows the annual change in average rent for condominium and rental apartments across different municipalities in Canada in January 2020 and January 2021.
 Vancouver has the most expensive rents in the country at $2,178 per month for a condo or rental apartment, a decline of 5% year over year. In January of last year, Toronto was the most expensive municipality (former City of Toronto, pre-amalgamation), but rents have dropped 21% annually to $2,000 on average.
Elsewhere In Ontario, both Hamilton and Kitchener experienced increases in average rent year over year. The average rent in Hamilton increased by 10% to $1,820, and the average rent in Kitchener increased by 16% to $1,613.
Outside of old Toronto, the areas with the largest annual rent declines in January 2021 were Etobicoke, with a decrease of 18% to $1,926 and North York, with a decline of 15% to $1,936.
Annual Change in Average Rent by Municipality for All Property Types in Southwestern Ontario
This image shows the average rent for all property types in select municipalities in southwestern Ontario, as well as the annual change in average rent.
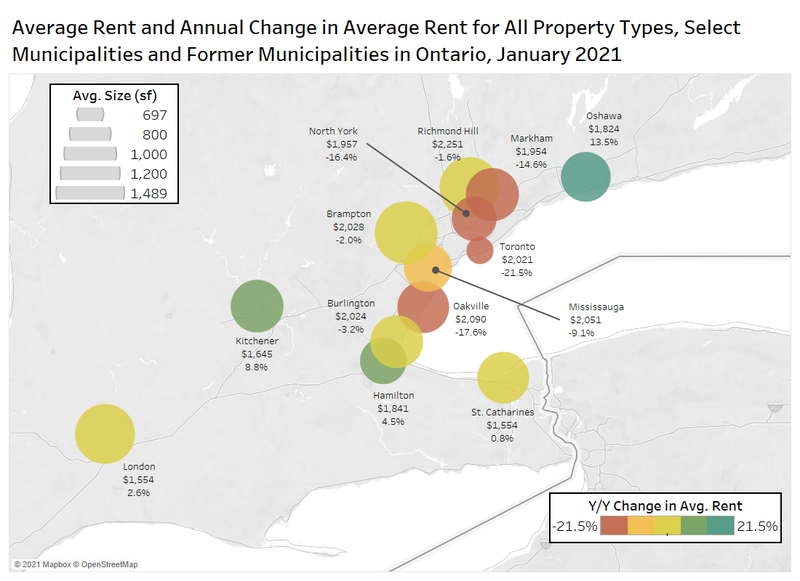 Oshawa and Kitchener experienced the highest annual growth rates. The average rent in Oshawa increased by 13.5%, while the average rent in Kitchener increased by 8.8%. Part of the increase in Oshawa can be attributed to a change in the composition of listings.
Average rents have increased in places like London, St. Catharines, and Hamilton, but declined significantly in Oakville, Mississauga and Markham.
GTA Condo Rental Market
In January 2020, the average rent per square foot for a condominium apartment in Downtown Toronto was $3.92 psf. Throughout the course of the year, the average rent has steadily declined, ending up at $3.12 psf in January 2021. This represents a more than 20% decrease year over year.
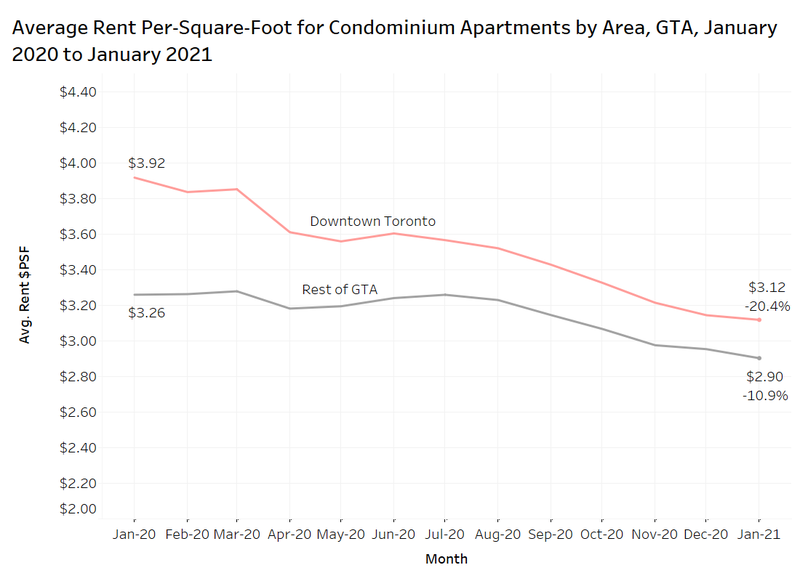 The rest of the GTA performed slightly better than the downtown core, with the average rent per square foot declining by nearly 11%. The average rent elsewhere in the GTA fell from $3.26 psf in January of last year to $2.90 psf in January 2021. Downtown Toronto remains more expensive than the rest of the GTA in terms of average rent per square foot, but is also declining at a much faster rate. The downtown area was 20% more expensive than the rest of the GTA in January of 2020, but that rate declined to just 8% last month.
Conclusion
Not a lot has changed month over month in the rental market in Canada. The average rent continues to decline nationally and the major decline in Toronto continues.
Many of the major resale housing markets in Canada are a feeding frenzy of activity, with low interest rates and changing housing demands fueling a buying spree, however, it’s not having an impact on the rental market in any meaningful way.
The latest Canada Mortgage and Housing Corporation data came out, showing the vacancy rate in Canada increased from 2.2% to 3.2% for rental apartments, as the pandemic has cut immigration, reduced household formation, and kept many students at home with their parents.
Given the latest COVID-19 numbers and the slow vaccination rollout, a return to work en masse is not expected for several months, and could push the recovery we were forecasting for the second half of this year back until 2022.
Please keep checking this link every month for an updated report on the state of the rental market in Canada.
Rentals.ca Data
The data used in this analysis is based on monthly listings from Rentals.ca. The data is much different than the more familiar numbers collected and published by Canada Mortgage Housing Corporation (CMHC).
Rentals.ca data includes basement apartments, rental apartments, condominium apartments, townhouses, semi-detached houses and single-detached houses, where CMHC’s primary rental data only includes rental apartments and rental townhouses. CMHC collects some data on the secondary market, but it is reported separately.
The CMHC rental rates are based on the entire universe of purpose-built rental units in Canada (the stock), while Rentals.ca data is primarily based on the asking rents of vacated units only (the flow) — this is a smaller sample size, but more representative of the actual market rent a prospective tenant encounters. The Rentals.ca data set typically produces much higher rental rates in comparison to CMHC, as vacated units are not subject to rent control.
The average and median rental rates via Rentals.ca can also skew higher than CMHC’s data for several reasons: The inclusion of larger and more expensive unit types like singles, row units and condos; the survivorship bias (overpriced units remain in the sample longer); and the multiple listings of the same property at different rent levels every month.
It should also be noted that properties listed for above $5,000 a month and below $500 a month are eliminated from the sample of units analyzed. Also, short-term leases, single-room rentals, and furnished rental units are eliminated from the sample where identifiable.

Rentals.ca is Canada’s premier online marketplace for renters and landlords, providing a comprehensive suite of tools and resources tailored to simplify the rental process. With an extensive selection of listings across the country, Rentals.ca offers user-friendly search functionality that helps renters find their perfect home efficiently. For landlords, Rentals.ca delivers effective advertising solutions to maximize visibility and fill vacancies faster. Committed to innovation and excellence, Rentals.ca aims to empower users with up-to-date market insights and expert guidance, making renting easier and more accessible for everyone.